
- Start >
- Rivers >
- Waterlevel >
- Bayern >
- Hörmannsberg >
- Chart of year

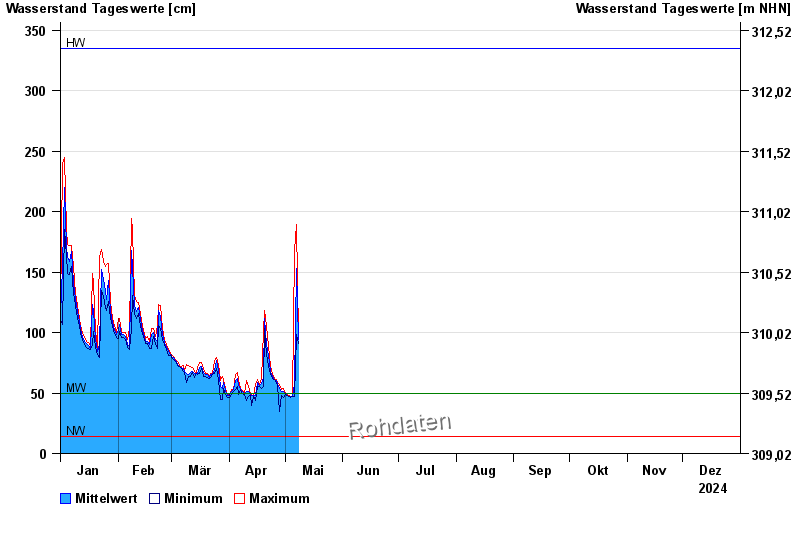
Chart of year Hörmannsberg / Gaißa
Waterlevel from 01.01.2024 to 31.12.2024
| Date | Mean value [cm] | Maximum [cm] | Minimum [cm] |
|---|---|---|---|
| 31.12.2024 | 54 | 54 | 53 |
| 30.12.2024 | 55 | 57 | 52 |
| 29.12.2024 | 55 | 55 | 55 |
| 28.12.2024 | 57 | 60 | 55 |
| 27.12.2024 | 60 | 60 | 60 |
| 26.12.2024 | 64 | 67 | 57 |
| 25.12.2024 | 70 | 75 | 67 |
© Bayerisches Landesamt für Umwelt 2024