
- Start >
- Rivers >
- Waterlevel >
- Bayern >
- Illesheim >
- Chart of year

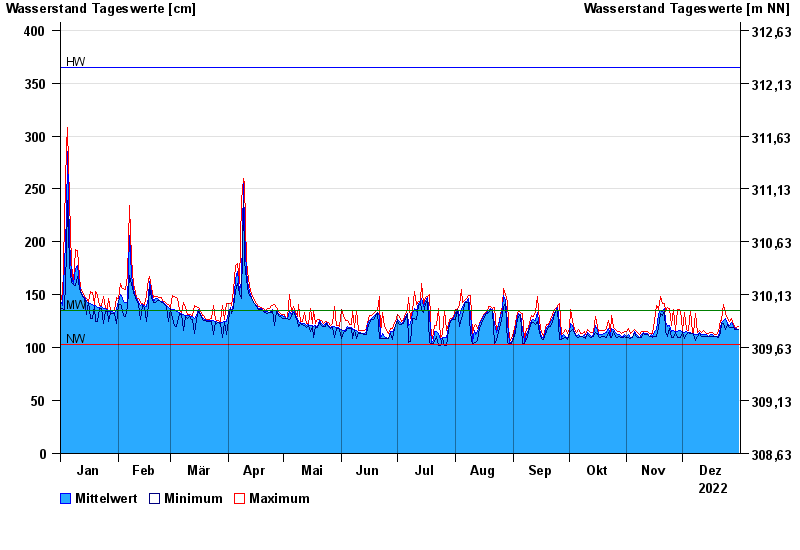
Chart of year Illesheim / Aisch
Waterlevel from 01.01.2022 to 31.12.2022
note
Wasserstand und Abfluss wird zeitweise durch Biberdamm beeinflusst.
| Date | Mean value [cm] | Maximum [cm] | Minimum [cm] |
|---|---|---|---|
| 31.12.2022 | 117 | 120 | 117 |
| 30.12.2022 | 118 | 119 | 117 |
| 29.12.2022 | 118 | 120 | 117 |
| 28.12.2022 | 120 | 122 | 119 |
| 27.12.2022 | 124 | 128 | 119 |
| 26.12.2022 | 121 | 125 | 119 |
| 25.12.2022 | 123 | 128 | 122 |
© Bayerisches Landesamt für Umwelt 2025