
- Start >
- Rivers >
- Waterlevel >
- Bayern >
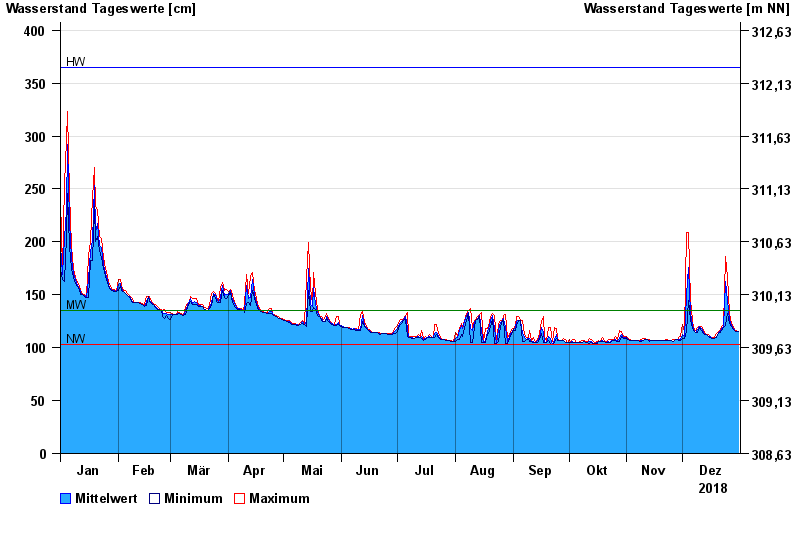
- Illesheim >
- Chart of year

Chart of year Illesheim / Aisch
Waterlevel from 01.01.2018 to 31.12.2018
note
Wasserstand und Abfluss wird zeitweise durch Biberdamm beeinflusst.
| Date | Mean value [cm] | Maximum [cm] | Minimum [cm] |
|---|---|---|---|
| 31.12.2018 | 115 | 115 | 115 |
| 30.12.2018 | 115 | 116 | 115 |
| 29.12.2018 | 116 | 117 | 116 |
| 28.12.2018 | 118 | 120 | 117 |
| 27.12.2018 | 121 | 123 | 120 |
| 26.12.2018 | 127 | 132 | 123 |
| 25.12.2018 | 145 | 166 | 132 |
© Bayerisches Landesamt für Umwelt 2025