
- Start >
- Rivers >
- Waterlevel >
- Bayern >
- Johannisthal >
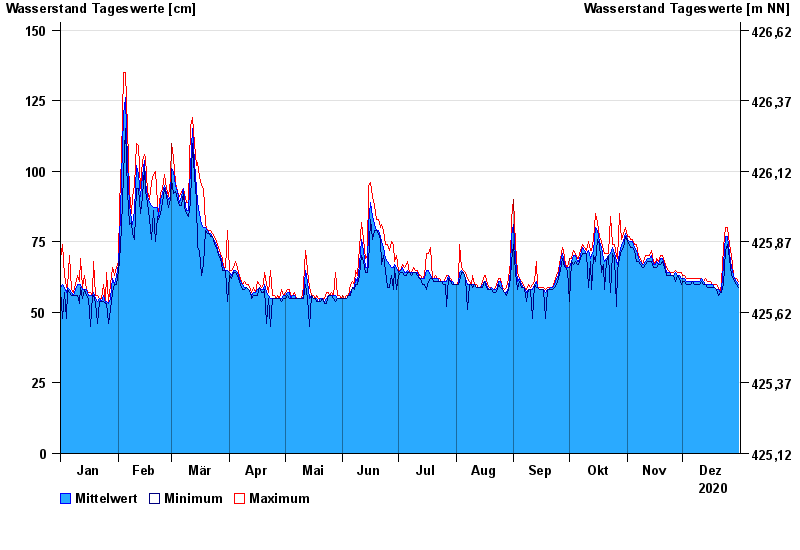
- Chart of year

Chart of year Johannisthal / Tirschenreuther Waldnaab
Waterlevel from 01.01.2020 to 31.12.2020
- 02.11.1998 Wasserstand: 221 cm
- 03.01.2003 Wasserstand: 220 cm
- 14.01.2011 Wasserstand: 214 cm
- 13.02.2005 Wasserstand: 203 cm
- 03.06.2013 Wasserstand: 202 cm
| Date | Mean value [cm] | Maximum [cm] | Minimum [cm] |
|---|---|---|---|
| 31.12.2020 | 60 | 61 | 59 |
| 30.12.2020 | 61 | 62 | 60 |
| 29.12.2020 | 62 | 62 | 61 |
| 28.12.2020 | 63 | 63 | 62 |
| 27.12.2020 | 66 | 70 | 63 |
| 26.12.2020 | 71 | 74 | 69 |
| 25.12.2020 | 77 | 80 | 74 |
© Bayerisches Landesamt für Umwelt 2025