
- Start >
- Rivers >
- Waterlevel >
- Bayern >
- Langenau >
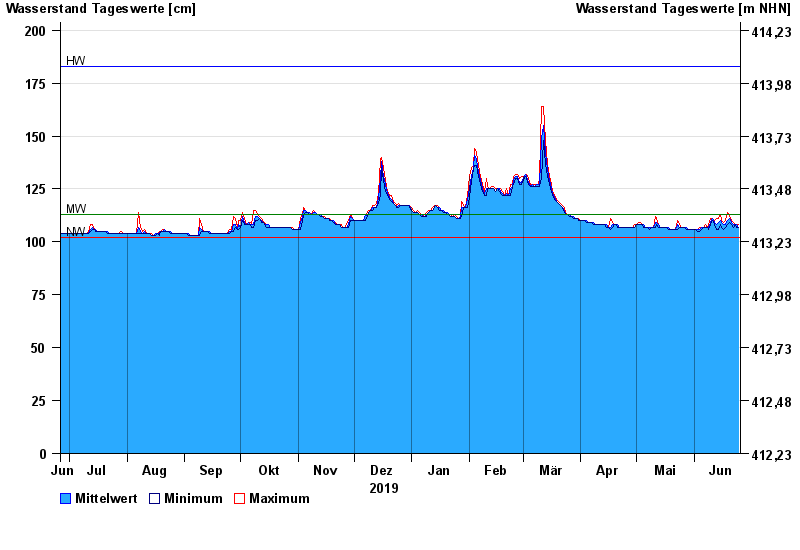
- Chart of year

Chart of year Langenau / Langenaubach
Waterlevel from 26.06.2019 to 25.06.2020
| Date | Mean value [cm] | Maximum [cm] | Minimum [cm] |
|---|---|---|---|
| 25.06.2020 | 107 | 108 | 107 |
| 24.06.2020 | 108 | 108 | 107 |
| 23.06.2020 | 108 | 108 | 108 |
| 22.06.2020 | 108 | 109 | 107 |
| 21.06.2020 | 109 | 110 | 108 |
| 20.06.2020 | 111 | 112 | 109 |
| 19.06.2020 | 110 | 114 | 108 |
© Bayerisches Landesamt für Umwelt 2024