
- Start >
- Rivers >
- Waterlevel >
- Bayern >
- Lauben >
- Chart of year

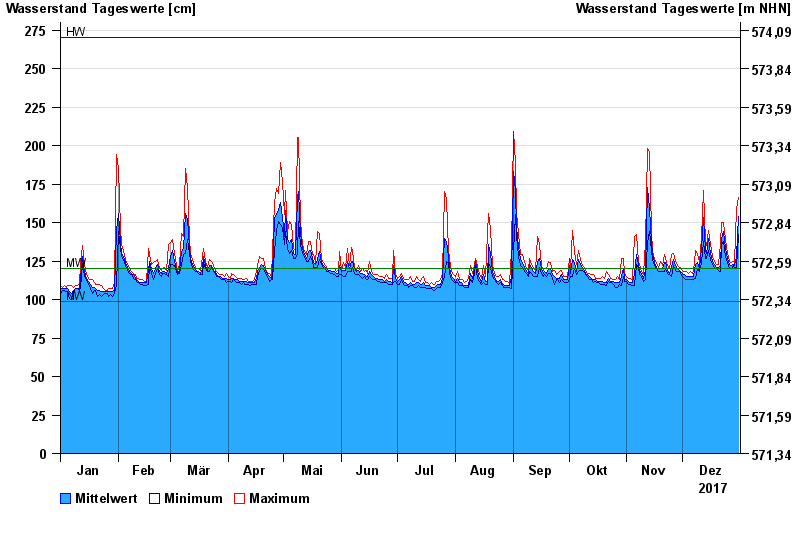
Chart of year Lauben / Günz
Waterlevel from 01.01.2017 to 31.12.2017
| Date | Mean value [cm] | Maximum [cm] | Minimum [cm] |
|---|---|---|---|
| 31.12.2017 | 154 | 166 | 142 |
| 30.12.2017 | 128 | 159 | 121 |
| 29.12.2017 | 122 | 124 | 120 |
| 28.12.2017 | 123 | 125 | 122 |
| 27.12.2017 | 122 | 124 | 120 |
| 26.12.2017 | 123 | 125 | 120 |
| 25.12.2017 | 127 | 130 | 124 |
© Bayerisches Landesamt für Umwelt 2025