
- Start >
- Rivers >
- Waterlevel >
- Bayern >
- Leming >
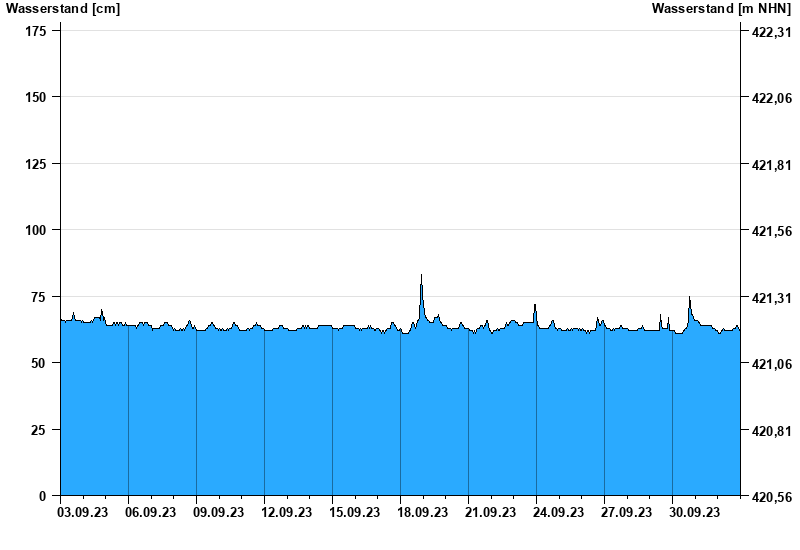
- Chart of month

Chart of month Leming / Freybach
Waterlevel from 03.09.2023 to 02.10.2023
- 01.08.1991 Wasserstand: 237 cm
- 17.05.2013 Wasserstand: 222 cm
- 28.05.1986 Wasserstand: 215 cm
- 13.08.2002 Wasserstand: 212 cm
- 21.12.1993 Wasserstand: 212 cm
| Date | Waterlevel [cm] |
|---|---|
| 03.10.2023 00:45 | 62 |
| 03.10.2023 00:30 | 62 |
| 03.10.2023 00:15 | 62 |
| 03.10.2023 00:00 | 62 |
| 02.10.2023 23:45 | 62 |
| 02.10.2023 23:30 | 62 |
| 02.10.2023 23:15 | 62 |
© Bayerisches Landesamt für Umwelt 2024