
- Start >
- Rivers >
- Waterlevel >
- Bayern >
- Leming >
- Chart of year

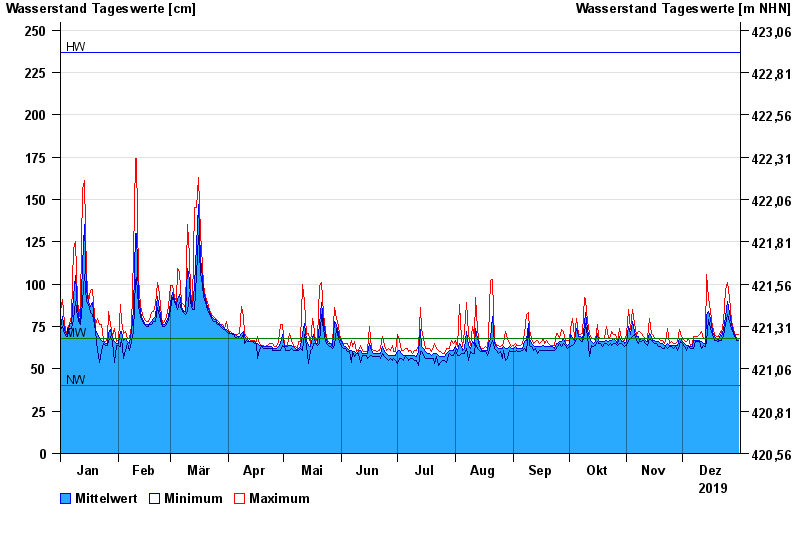
Chart of year Leming / Freybach
Waterlevel from 01.01.2019 to 31.12.2019
| Date | Mean value [cm] | Maximum [cm] | Minimum [cm] |
|---|---|---|---|
| 31.12.2019 | 68 | 70 | 67 |
| 30.12.2019 | 68 | 70 | 67 |
| 29.12.2019 | 70 | 71 | 69 |
| 28.12.2019 | 72 | 73 | 71 |
| 27.12.2019 | 76 | 78 | 73 |
| 26.12.2019 | 83 | 92 | 78 |
| 25.12.2019 | 90 | 101 | 82 |
© Bayerisches Landesamt für Umwelt 2025