
- Start >
- Rivers >
- Waterlevel >
- Bayern >
- Neumühle >
- Chart of year

Chart of year Neumühle / Rednitz
Waterlevel from 01.01.2024 to 31.12.2024
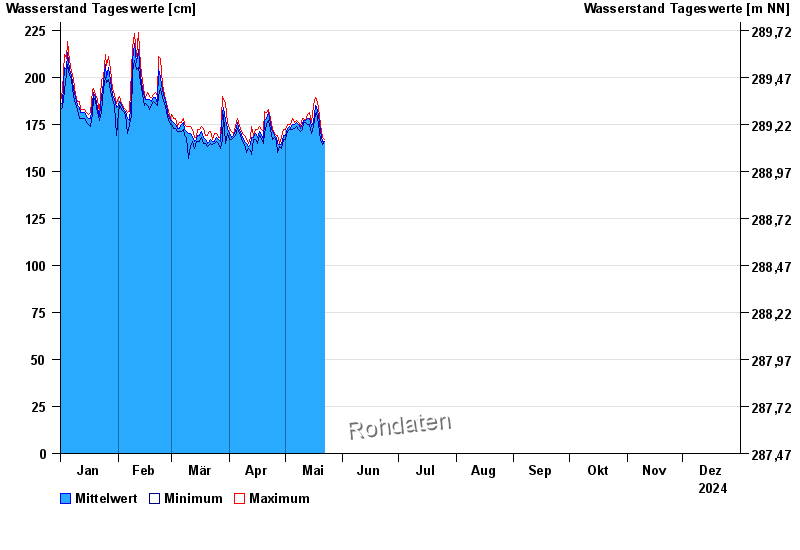
| Date | Mean value [cm] | Maximum [cm] | Minimum [cm] |
|---|---|---|---|
| 19.10.2024 | 177 | 177 | 176 |
| 18.10.2024 | 176 | 178 | 174 |
| 17.10.2024 | 182 | 185 | 178 |
| 16.10.2024 | 193 | 207 | 185 |
| 15.10.2024 | 194 | 208 | 179 |
| 14.10.2024 | 174 | 179 | 170 |
| 13.10.2024 | 172 | 174 | 170 |
© Bayerisches Landesamt für Umwelt 2024