
- Start >
- Rivers >
- Waterlevel >
- Bayern >
- Neusling >
- Chart of year

Chart of year Neusling / Neuslinger Graben
Waterlevel from 01.01.2020 to 31.12.2020
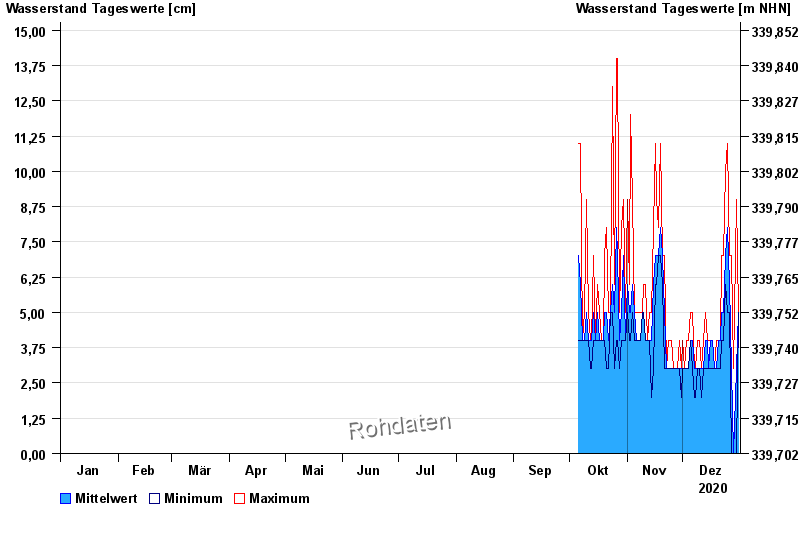
| Date | Mean value [cm] | Maximum [cm] | Minimum [cm] |
|---|---|---|---|
| 31.12.2020 | 5 | 5 | 5 |
| 30.12.2020 | 3 | 9 | -- |
| 29.12.2020 | 1 | 5 | -- |
| 28.12.2020 | -- | 3 | -- |
| 27.12.2020 | 3 | 7 | -- |
| 26.12.2020 | 6 | 7 | 5 |
| 25.12.2020 | 8 | 11 | 5 |
© Bayerisches Landesamt für Umwelt 2025