
- Start >
- Rivers >
- Waterlevel >
- Bayern >
- Neustadt >
- Chart of year

Chart of year Neustadt / Waldnaab
Waterlevel from 30.09.2021 to 29.09.2022
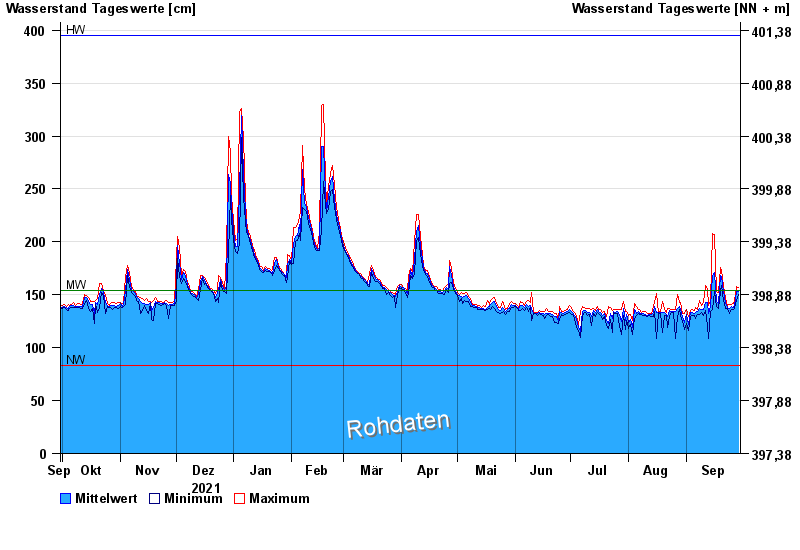
| Date | Mean value [cm] | Maximum [cm] | Minimum [cm] |
|---|---|---|---|
| 29.09.2022 | 153 | 157 | 150 |
| 28.09.2022 | 153 | 158 | 145 |
| 27.09.2022 | 140 | 145 | 137 |
| 26.09.2022 | 138 | 142 | 136 |
| 25.09.2022 | 139 | 141 | 136 |
| 24.09.2022 | 137 | 141 | 132 |
| 23.09.2022 | 138 | 140 | 137 |
© Bayerisches Landesamt für Umwelt 2025