
- Start >
- Rivers >
- Waterlevel >
- Bayern >
- Obernau >
- Chart of year

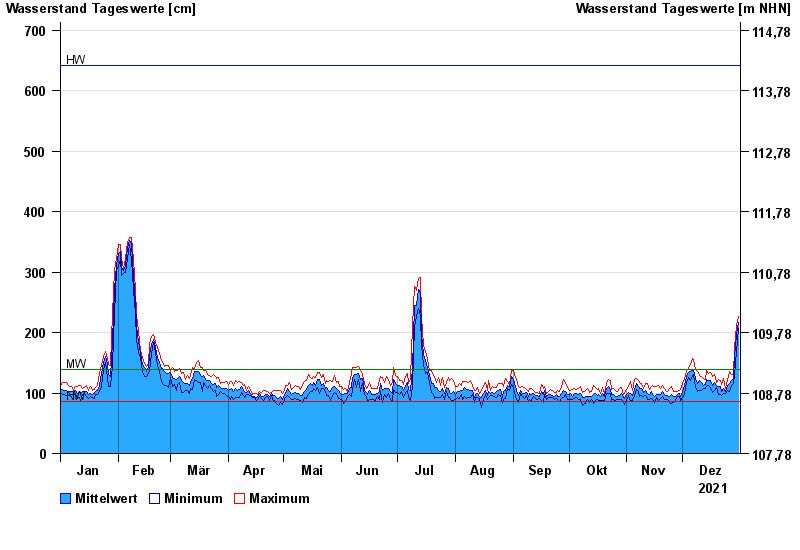
Chart of year Obernau / Main
Waterlevel from 01.01.2021 to 31.12.2021
| Date | Mean value [cm] | Maximum [cm] | Minimum [cm] |
|---|---|---|---|
| 31.12.2021 | 217 | 227 | 207 |
| 30.12.2021 | 196 | 211 | 169 |
| 29.12.2021 | 160 | 175 | 130 |
| 28.12.2021 | 122 | 130 | 115 |
| 27.12.2021 | 120 | 130 | 113 |
| 26.12.2021 | 116 | 135 | 103 |
| 25.12.2021 | 113 | 120 | 104 |
© Bayerisches Landesamt für Umwelt 2025