
- Start >
- Rivers >
- Waterlevel >
- Bayern >
- Peternerbrücke >
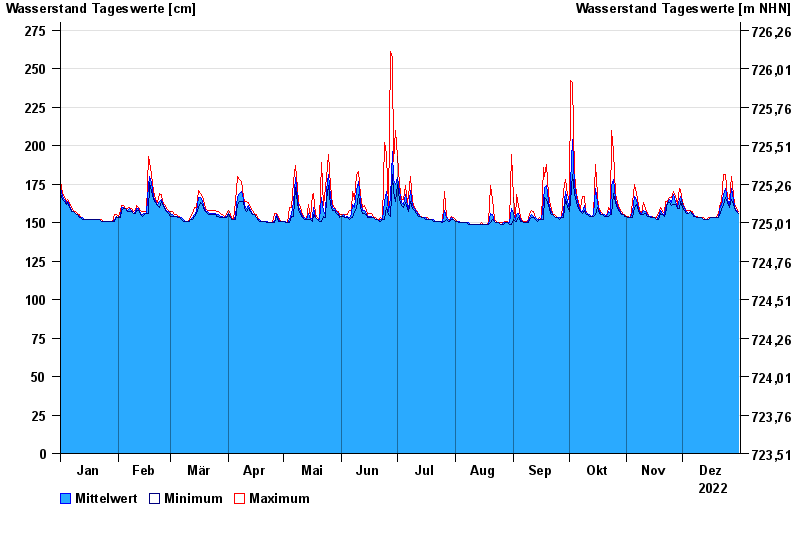
- Chart of year

Chart of year Peternerbrücke / Jachen
Waterlevel from 01.01.2022 to 31.12.2022
- 23.08.2005 Wasserstand: 346 cm
- 22.05.1999 Wasserstand: 338 cm
- 03.06.2010 Wasserstand: 314 cm
- 02.06.2013 Wasserstand: 313 cm
- 04.08.2020 Wasserstand: 306 cm
| Date | Mean value [cm] | Maximum [cm] | Minimum [cm] |
|---|---|---|---|
| 31.12.2022 | 156 | 157 | 156 |
| 30.12.2022 | 158 | 159 | 157 |
| 29.12.2022 | 160 | 162 | 159 |
| 28.12.2022 | 165 | 168 | 162 |
| 27.12.2022 | 172 | 180 | 165 |
| 26.12.2022 | 161 | 165 | 160 |
| 25.12.2022 | 165 | 166 | 163 |
© Bayerisches Landesamt für Umwelt 2025