
- Start >
- Rivers >
- Waterlevel >
- Bayern >
- Pfelling >
- Chart of year

Chart of year Pfelling / Donau
Waterlevel from 01.01.2017 to 31.12.2017
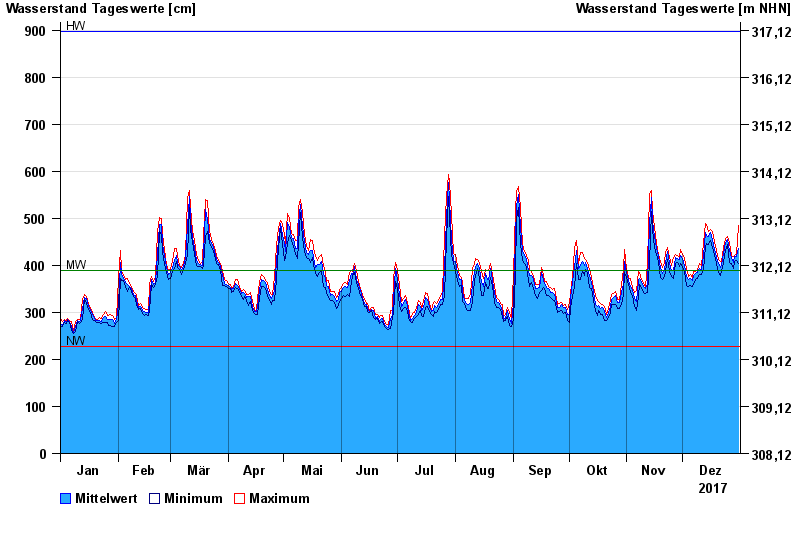
| Date | Mean value [cm] | Maximum [cm] | Minimum [cm] |
|---|---|---|---|
| 31.12.2017 | 436 | 484 | 403 |
| 30.12.2017 | 419 | 423 | 411 |
| 29.12.2017 | 418 | 420 | 409 |
| 28.12.2017 | 407 | 418 | 393 |
| 27.12.2017 | 415 | 420 | 405 |
| 26.12.2017 | 431 | 449 | 407 |
| 25.12.2017 | 454 | 462 | 445 |
© Bayerisches Landesamt für Umwelt 2025