
- Start >
- Rivers >
- Waterlevel >
- Bayern >
- Pfelling >
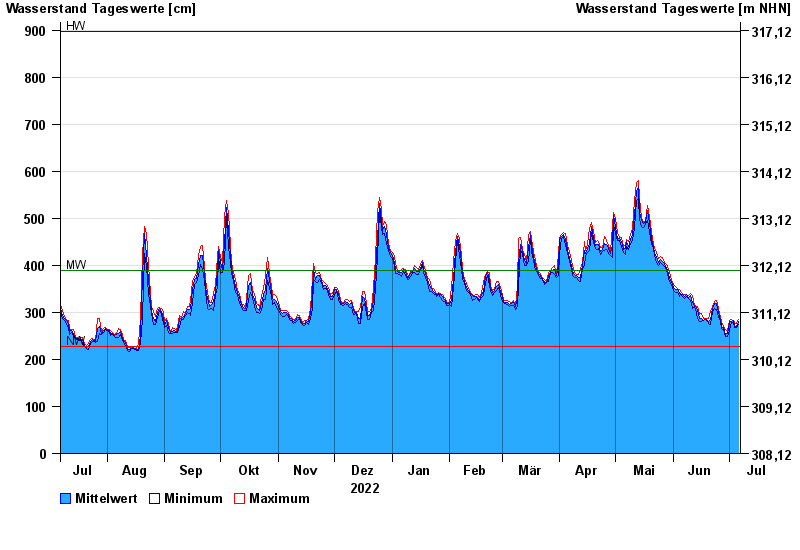
- Chart of year

Chart of year Pfelling / Donau
Waterlevel from 07.07.2022 to 06.07.2023
| Date | Mean value [cm] | Maximum [cm] | Minimum [cm] |
|---|---|---|---|
| 06.07.2023 | 280 | 285 | 275 |
| 05.07.2023 | 271 | 276 | 268 |
| 04.07.2023 | 270 | 279 | 267 |
| 03.07.2023 | 282 | 283 | 279 |
| 02.07.2023 | 281 | 284 | 279 |
| 01.07.2023 | 278 | 283 | 261 |
| 30.06.2023 | 256 | 261 | 248 |
© Bayerisches Landesamt für Umwelt 2025