
- Start >
- Rivers >
- Waterlevel >
- Bayern >
- Rappoldshofen >
- Chart of year

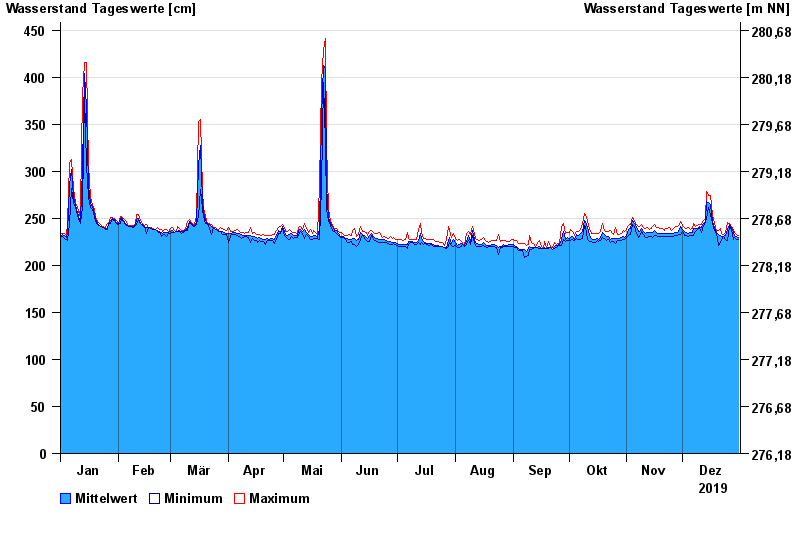
Chart of year Rappoldshofen / Aisch
Waterlevel from 01.01.2019 to 31.12.2019
| Date | Mean value [cm] | Maximum [cm] | Minimum [cm] |
|---|---|---|---|
| 31.12.2019 | 230 | 232 | 227 |
| 30.12.2019 | 231 | 233 | 228 |
| 29.12.2019 | 232 | 235 | 230 |
| 28.12.2019 | 235 | 238 | 228 |
| 27.12.2019 | 239 | 241 | 238 |
| 26.12.2019 | 243 | 244 | 241 |
| 25.12.2019 | 238 | 246 | 226 |
© Bayerisches Landesamt für Umwelt 2025