
- Start >
- Rivers >
- Waterlevel >
- Bayern >
- Rasch >
- Chart of year

Chart of year Rasch / Schwarzach
Waterlevel from 01.01.2024 to 31.12.2024
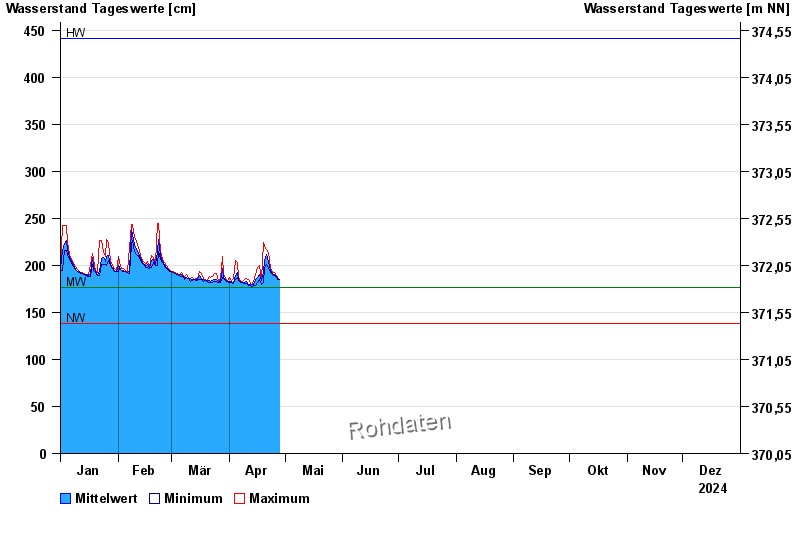
| Date | Mean value [cm] | Maximum [cm] | Minimum [cm] |
|---|---|---|---|
| 31.12.2024 | 183 | 184 | 183 |
| 30.12.2024 | 184 | 184 | 182 |
| 29.12.2024 | 184 | 185 | 184 |
| 28.12.2024 | 185 | 186 | 184 |
| 27.12.2024 | 186 | 186 | 185 |
| 26.12.2024 | 186 | 187 | 186 |
| 25.12.2024 | 188 | 189 | 187 |
© Bayerisches Landesamt für Umwelt 2025