
- Start >
- Rivers >
- Waterlevel >
- Bayern >
- Rieblich >
- Chart of year

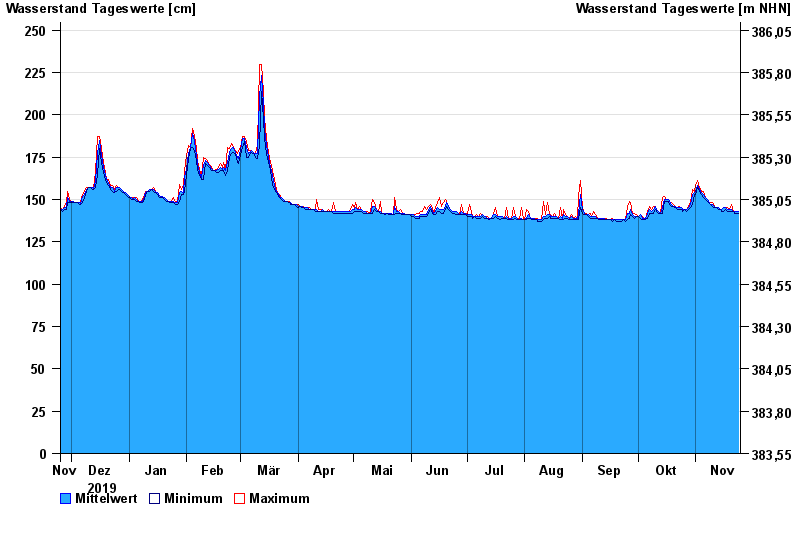
Chart of year Rieblich / Rodach
Waterlevel from 25.11.2019 to 24.11.2020
| Date | Mean value [cm] | Maximum [cm] | Minimum [cm] |
|---|---|---|---|
| 24.11.2020 | 143 | 143 | 142 |
| 23.11.2020 | 143 | 143 | 142 |
| 22.11.2020 | 143 | 143 | 142 |
| 21.11.2020 | 143 | 143 | 143 |
| 20.11.2020 | 144 | 147 | 143 |
| 19.11.2020 | 144 | 144 | 143 |
| 18.11.2020 | 144 | 145 | 143 |
© Bayerisches Landesamt für Umwelt 2025