
- Start >
- Rivers >
- Waterlevel >
- Bayern >
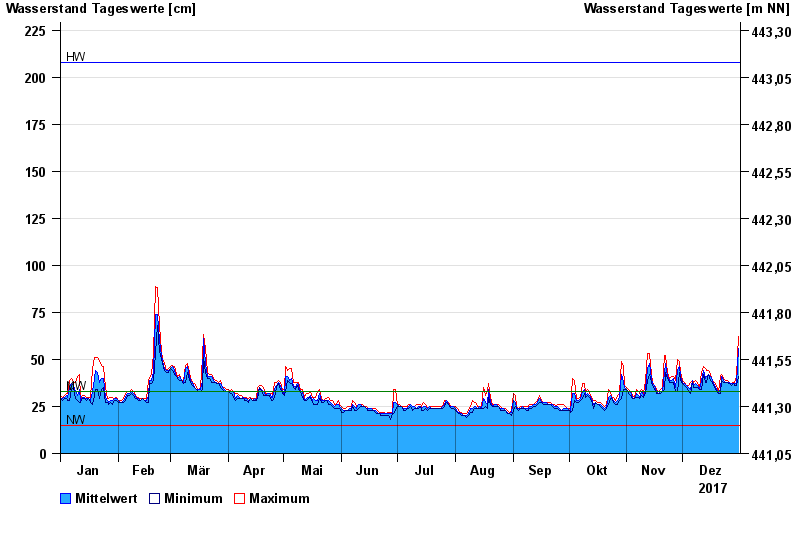
- Rötz Speicherzufluss >
- Chart of year

Chart of year Rötz Speicherzufluss / Schwarzach
Waterlevel from 01.01.2017 to 31.12.2017
| Date | Mean value [cm] | Maximum [cm] | Minimum [cm] |
|---|---|---|---|
| 31.12.2017 | 56 | 62 | 41 |
| 30.12.2017 | 37 | 41 | 36 |
| 29.12.2017 | 37 | 38 | 36 |
| 28.12.2017 | 37 | 38 | 37 |
| 27.12.2017 | 37 | 37 | 36 |
| 26.12.2017 | 38 | 38 | 37 |
| 25.12.2017 | 38 | 39 | 38 |
© Bayerisches Landesamt für Umwelt 2025