
- Start >
- Rivers >
- Waterlevel >
- Bayern >
- Schlehdorf >
- Chart of year

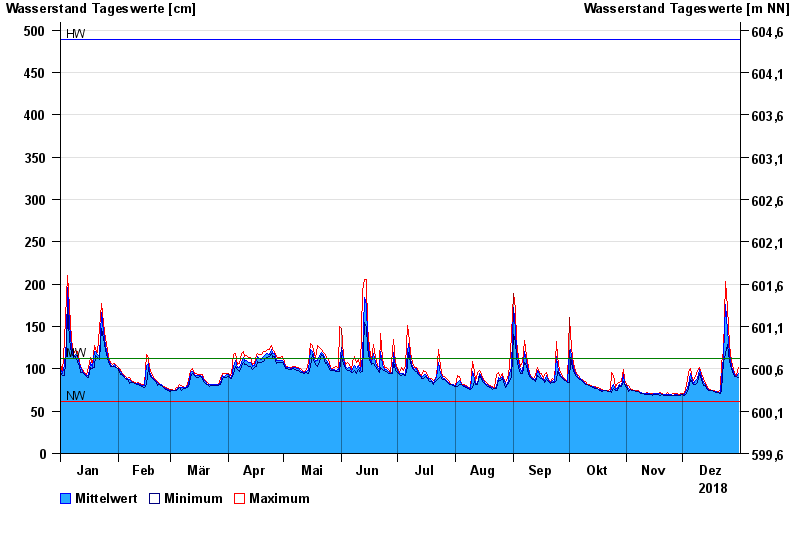
Chart of year Schlehdorf / Loisach
Waterlevel from 01.01.2018 to 31.12.2018
| Date | Mean value [cm] | Maximum [cm] | Minimum [cm] |
|---|---|---|---|
| 31.12.2018 | 95 | 101 | 90 |
| 30.12.2018 | 91 | 92 | 91 |
| 29.12.2018 | 93 | 95 | 91 |
| 28.12.2018 | 97 | 100 | 93 |
| 27.12.2018 | 103 | 109 | 100 |
| 26.12.2018 | 118 | 129 | 109 |
| 25.12.2018 | 145 | 173 | 129 |
© Bayerisches Landesamt für Umwelt 2025