
- Start >
- Rivers >
- Waterlevel >
- Bayern >
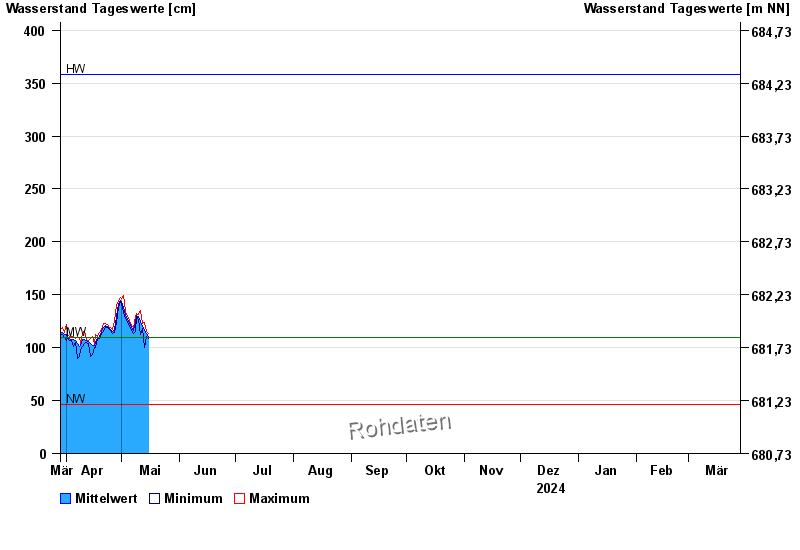
- Schmerold >
- Chart of year

Chart of year Schmerold / Mangfall
Waterlevel from 29.03.2024 to 28.03.2025
| Date | Mean value [cm] | Maximum [cm] | Minimum [cm] |
|---|---|---|---|
| 16.10.2024 | 127 | 128 | 122 |
| 15.10.2024 | 129 | 130 | 127 |
| 14.10.2024 | 131 | 133 | 128 |
| 13.10.2024 | 134 | 135 | 132 |
| 12.10.2024 | 137 | 140 | 135 |
| 11.10.2024 | 141 | 141 | 140 |
| 10.10.2024 | 136 | 141 | 131 |
© Bayerisches Landesamt für Umwelt 2024