
- Start >
- Rivers >
- Waterlevel >
- Bayern >
- Schönberg >
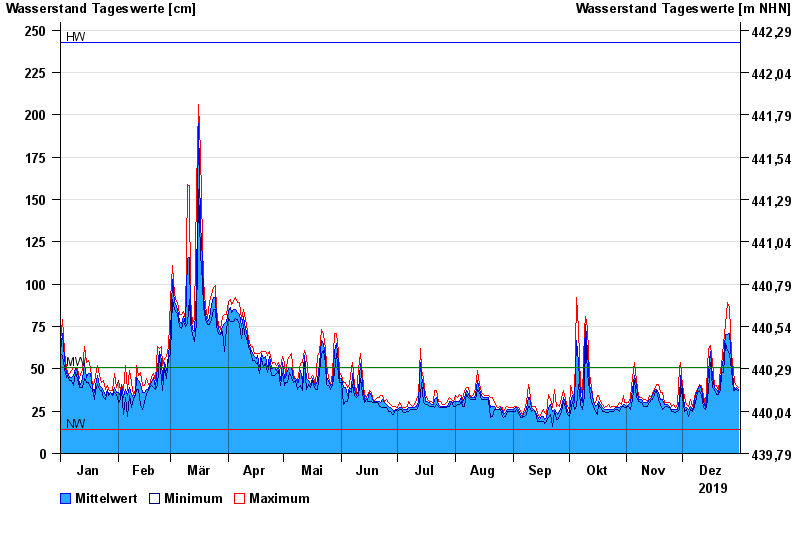
- Chart of year

Chart of year Schönberg / Große Ohe
Waterlevel from 01.01.2019 to 31.12.2019
| Date | Mean value [cm] | Maximum [cm] | Minimum [cm] |
|---|---|---|---|
| 31.12.2019 | 38 | 39 | 37 |
| 30.12.2019 | 39 | 40 | 38 |
| 29.12.2019 | 38 | 42 | 37 |
| 28.12.2019 | 41 | 49 | 37 |
| 27.12.2019 | 55 | 59 | 49 |
| 26.12.2019 | 71 | 86 | 59 |
| 25.12.2019 | 70 | 89 | 61 |
© Bayerisches Landesamt für Umwelt 2024