
- Start >
- Rivers >
- Waterlevel >
- Bayern >
- Schwandorf >
- Chart of year

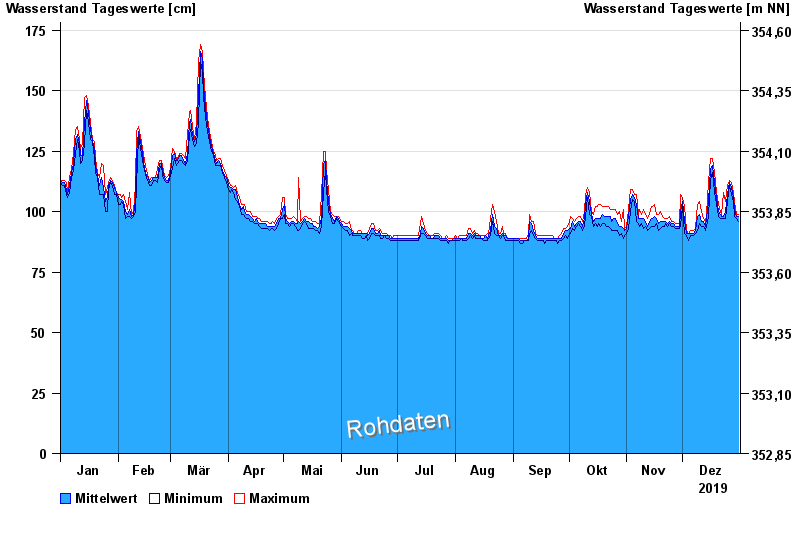
Chart of year Schwandorf / Naab
Waterlevel from 01.01.2019 to 31.12.2019
 Für diesen Pegel sind keine Hochwassermarken hinterlegt.
note
Pegel bis auf Weiteres außer Betrieb wegen Brückenbauarbeiten.
| Date | Mean value [cm] | Maximum [cm] | Minimum [cm] |
|---|---|---|---|
| 31.12.2019 | 98 | 99 | 96 |
| 30.12.2019 | 98 | 99 | 97 |
| 29.12.2019 | 101 | 104 | 98 |
| 28.12.2019 | 106 | 108 | 104 |
| 27.12.2019 | 110 | 112 | 107 |
| 26.12.2019 | 112 | 113 | 111 |
| 25.12.2019 | 107 | 111 | 104 |
© Bayerisches Landesamt für Umwelt 2025