
- Start >
- Rivers >
- Waterlevel >
- Bayern >
- Schweinhof >
- Chart of year

Chart of year Schweinhof / Brend
Waterlevel from 01.01.2018 to 31.12.2018
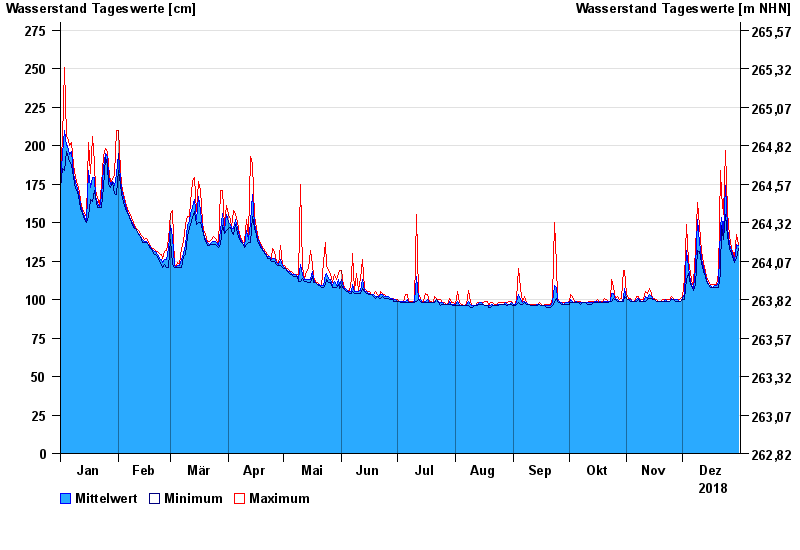
| Date | Mean value [cm] | Maximum [cm] | Minimum [cm] |
|---|---|---|---|
| 31.12.2018 | 135 | 136 | 133 |
| 30.12.2018 | 136 | 142 | 127 |
| 29.12.2018 | 125 | 127 | 124 |
| 28.12.2018 | 128 | 130 | 126 |
| 27.12.2018 | 132 | 133 | 130 |
| 26.12.2018 | 136 | 141 | 133 |
| 25.12.2018 | 147 | 157 | 141 |
© Bayerisches Landesamt für Umwelt 2025