
- Start >
- Rivers >
- Waterlevel >
- Bayern >
- Trausnitz u. d. Mühle >
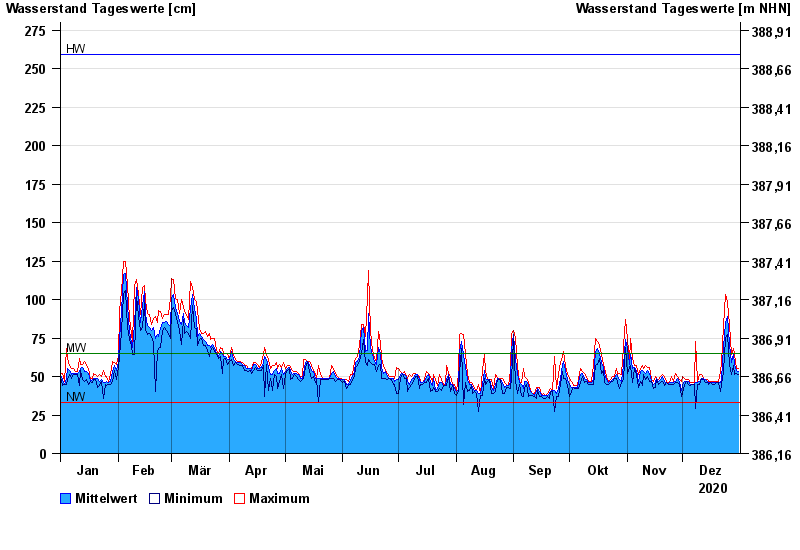
- Chart of year

Chart of year Trausnitz u. d. Mühle / Pfreimd
Waterlevel from 01.01.2020 to 31.12.2020
| Date | Mean value [cm] | Maximum [cm] | Minimum [cm] |
|---|---|---|---|
| 31.12.2020 | 53 | 55 | 51 |
| 30.12.2020 | 54 | 55 | 52 |
| 29.12.2020 | 58 | 64 | 51 |
| 28.12.2020 | 65 | 68 | 57 |
| 27.12.2020 | 59 | 64 | 51 |
| 26.12.2020 | 71 | 84 | 58 |
| 25.12.2020 | 89 | 98 | 77 |
© Bayerisches Landesamt für Umwelt 2024