
- Start >
- Rivers >
- Waterlevel >
- Bayern >
- Unterbruck Flutmulde >
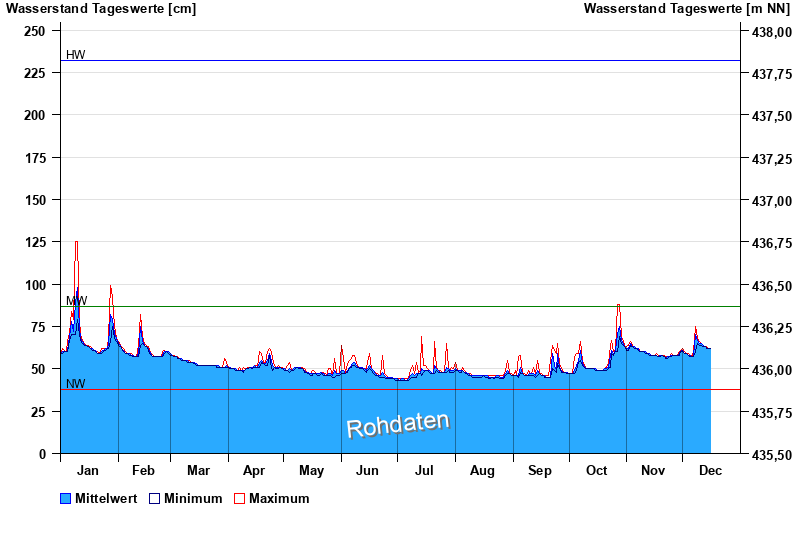
- Chart of year

Chart of year Unterbruck Flutmulde / Haidenaab
Waterlevel from 01.01.2025 to 31.12.2025
| Date | Mean value [cm] | Maximum [cm] | Minimum [cm] |
|---|---|---|---|
| 28.03.2025 | 51 | 51 | 51 |
| 27.03.2025 | 52 | 52 | 51 |
| 26.03.2025 | 52 | 52 | 51 |
| 25.03.2025 | 52 | 52 | 52 |
| 24.03.2025 | 52 | 52 | 52 |
| 23.03.2025 | 52 | 52 | 52 |
| 22.03.2025 | 52 | 52 | 52 |
© Bayerisches Landesamt für Umwelt 2025