
- Start >
- Rivers >
- Waterlevel >
- Bayern >
- Wasserburg >
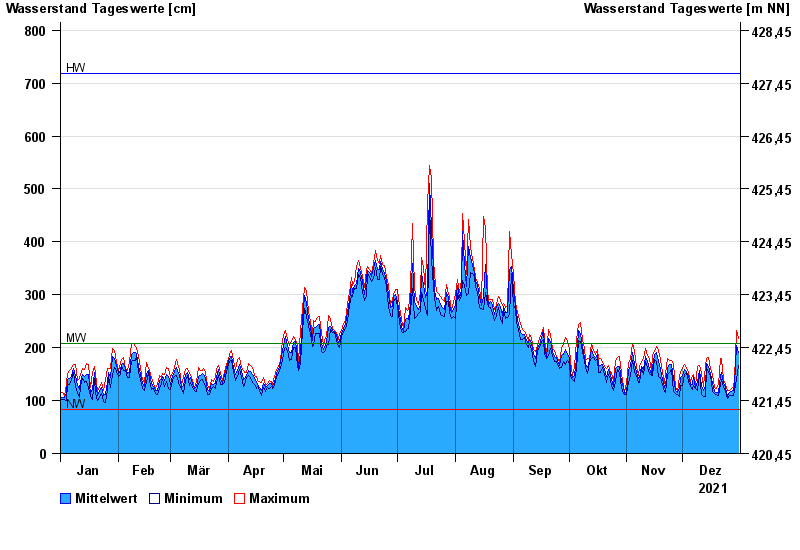
- Chart of year

Chart of year Wasserburg / Inn
Waterlevel from 01.01.2021 to 31.12.2021
| Date | Mean value [cm] | Maximum [cm] | Minimum [cm] |
|---|---|---|---|
| 31.12.2021 | 190 | 218 | 166 |
| 30.12.2021 | 205 | 233 | 139 |
| 29.12.2021 | 128 | 140 | 119 |
| 28.12.2021 | 119 | 124 | 109 |
| 27.12.2021 | 117 | 123 | 110 |
| 26.12.2021 | 115 | 120 | 109 |
| 25.12.2021 | 108 | 120 | 104 |
© Bayerisches Landesamt für Umwelt 2025