
- Start >
- Rivers >
- Waterlevel >
- Bayern >
- Weißenburg >
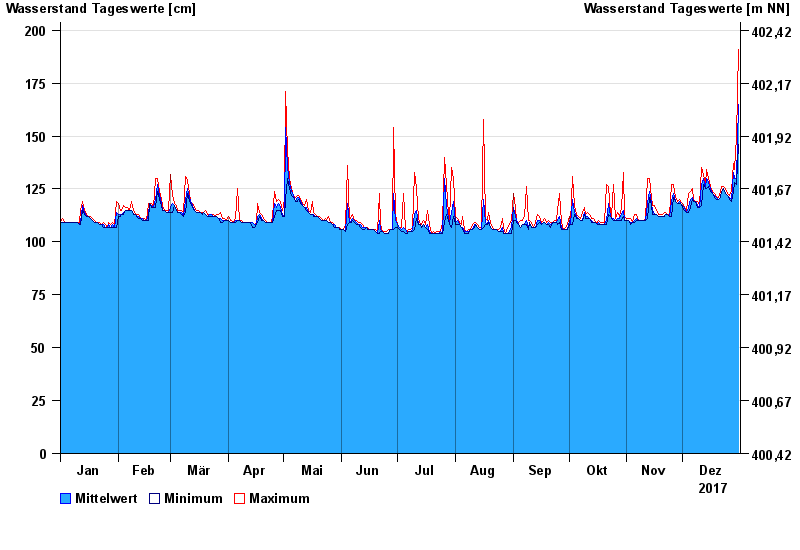
- Chart of year

Chart of year Weißenburg / Schwäbische Rezat
Waterlevel from 01.01.2017 to 31.12.2017
- 13.04.1994 Wasserstand: 269 cm
- 15.02.1990 Wasserstand: 262 cm
- 21.12.1993 Wasserstand: 260 cm
- 29.05.1985 Wasserstand: 259 cm
- 21.05.1985 Wasserstand: 248 cm
| Date | Mean value [cm] | Maximum [cm] | Minimum [cm] |
|---|---|---|---|
| 31.12.2017 | 165 | 191 | 146 |
| 30.12.2017 | 130 | 150 | 127 |
| 29.12.2017 | 130 | 134 | 128 |
| 28.12.2017 | 133 | 137 | 124 |
| 27.12.2017 | 120 | 124 | 119 |
| 26.12.2017 | 121 | 122 | 120 |
| 25.12.2017 | 122 | 123 | 122 |
© Bayerisches Landesamt für Umwelt 2025