
- Start >
- Rivers >
- Waterlevel >
- Oberer Main - Elbe >
- Bad Berneck >
- Chart of year

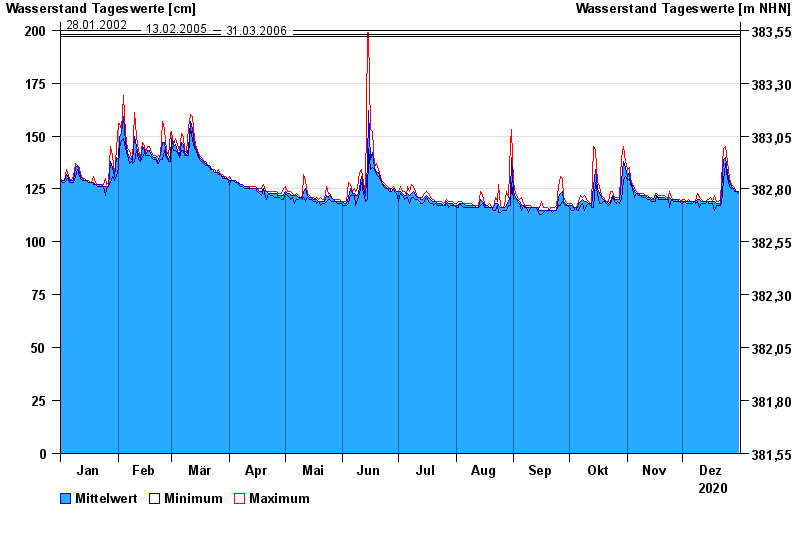
Chart of year Bad Berneck / Weißer Main
Waterlevel from 01.01.2020 to 31.12.2020
- 28.05.2006 Wasserstand: 242 cm
- 07.02.2012 Wasserstand: 208 cm
- 28.01.2002 Wasserstand: 200 cm
- 13.02.2005 Wasserstand: 198 cm
- 31.03.2006 Wasserstand: 197 cm
| Date | Mean value [cm] | Maximum [cm] | Minimum [cm] |
|---|---|---|---|
| 31.12.2020 | 124 | 124 | 123 |
| 30.12.2020 | 124 | 124 | 124 |
| 29.12.2020 | 125 | 125 | 124 |
| 28.12.2020 | 125 | 126 | 125 |
| 27.12.2020 | 126 | 127 | 125 |
| 26.12.2020 | 128 | 130 | 126 |
| 25.12.2020 | 133 | 138 | 130 |
© Bayerisches Landesamt für Umwelt 2025