
- Start >
- Rivers >
- Waterlevel >
- Oberer Main - Elbe >
- Erbendorf >
- Chart of year

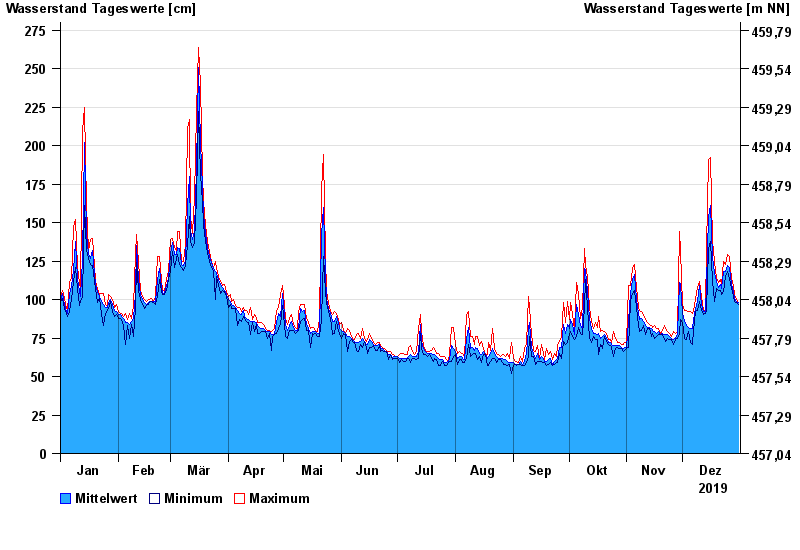
Chart of year Erbendorf / Fichtelnaab
Waterlevel from 01.01.2019 to 31.12.2019
| Date | Mean value [cm] | Maximum [cm] | Minimum [cm] |
|---|---|---|---|
| 31.12.2019 | 98 | 98 | 97 |
| 30.12.2019 | 99 | 100 | 98 |
| 29.12.2019 | 101 | 103 | 99 |
| 28.12.2019 | 105 | 109 | 102 |
| 27.12.2019 | 110 | 114 | 107 |
| 26.12.2019 | 121 | 128 | 114 |
| 25.12.2019 | 122 | 129 | 118 |
© Bayerisches Landesamt für Umwelt 2025