
- Start >
- Rivers >
- Waterlevel >
- Oberer Main - Elbe >
- Erlabrück >
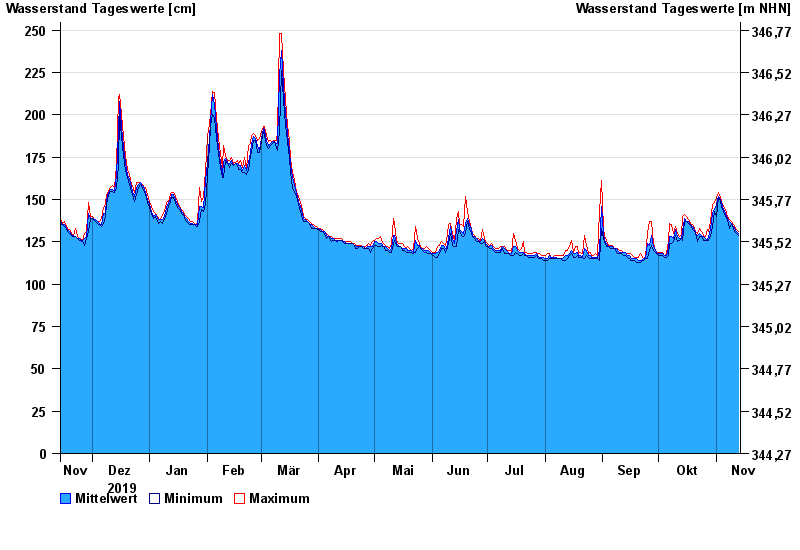
- Chart of year

Chart of year Erlabrück / Rodach
Waterlevel from 14.11.2019 to 13.11.2020
- 06.01.1982 Wasserstand: 289 cm
- 10.03.1981 Wasserstand: 287 cm
- 14.01.2011 Wasserstand: 283 cm
- 03.01.2003 Wasserstand: 280 cm
- 28.01.2002 Wasserstand: 280 cm
| Date | Mean value [cm] | Maximum [cm] | Minimum [cm] |
|---|---|---|---|
| 13.11.2020 | 130 | 131 | 129 |
| 12.11.2020 | 131 | 132 | 130 |
| 11.11.2020 | 133 | 134 | 131 |
| 10.11.2020 | 134 | 135 | 133 |
| 09.11.2020 | 136 | 137 | 135 |
| 08.11.2020 | 137 | 138 | 133 |
| 07.11.2020 | 139 | 140 | 138 |
© Bayerisches Landesamt für Umwelt 2024