
- Start >
- Rivers >
- Waterlevel >
- Oberer Main - Elbe >
- Erlabrück >
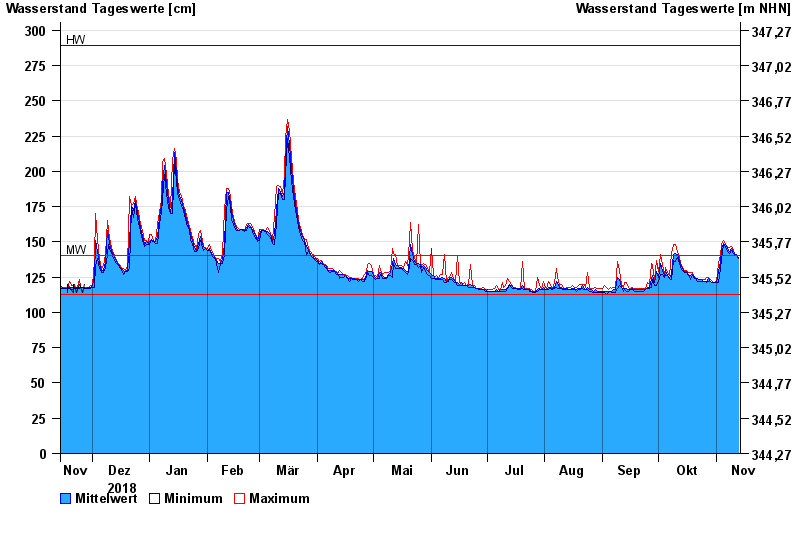
- Chart of year

Chart of year Erlabrück / Rodach
Waterlevel from 14.11.2018 to 13.11.2019
| Date | Mean value [cm] | Maximum [cm] | Minimum [cm] |
|---|---|---|---|
| 13.11.2019 | 139 | 140 | 138 |
| 12.11.2019 | 141 | 141 | 140 |
| 11.11.2019 | 142 | 142 | 141 |
| 10.11.2019 | 143 | 144 | 142 |
| 09.11.2019 | 145 | 147 | 144 |
| 08.11.2019 | 143 | 146 | 142 |
| 07.11.2019 | 145 | 147 | 143 |
© Bayerisches Landesamt für Umwelt 2024