
- Start >
- Rivers >
- Waterlevel >
- Oberer Main - Elbe >
- Förmitz Speicherzufluss >
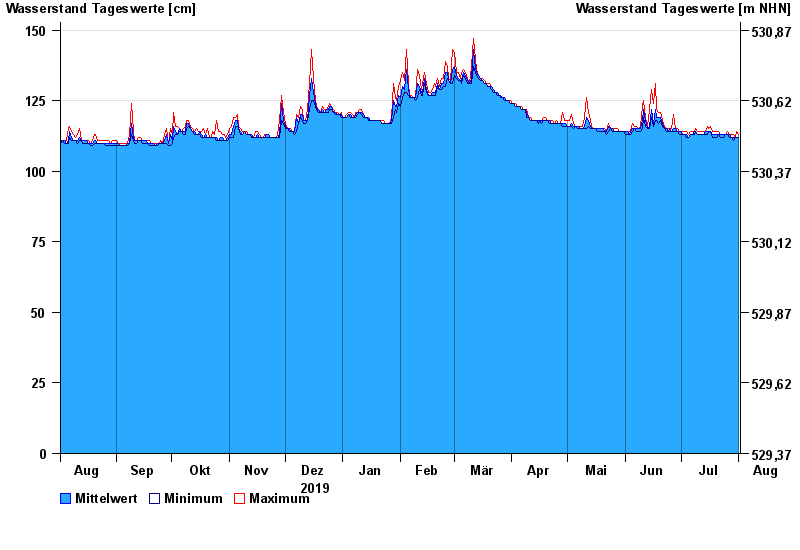
- Chart of year

Chart of year Förmitz Speicherzufluss / Förmitz
Waterlevel from 02.08.2019 to 01.08.2020
| Date | Mean value [cm] | Maximum [cm] | Minimum [cm] |
|---|---|---|---|
| 01.08.2020 | 112 | 113 | 112 |
| 31.07.2020 | 112 | 114 | 112 |
| 30.07.2020 | 112 | 112 | 112 |
| 29.07.2020 | 112 | 113 | 111 |
| 28.07.2020 | 112 | 113 | 112 |
| 27.07.2020 | 113 | 113 | 112 |
| 26.07.2020 | 113 | 114 | 113 |
© Bayerisches Landesamt für Umwelt 2024