
- Start >
- Rivers >
- Waterlevel >
- Oberer Main - Elbe >
- Friedersdorf >
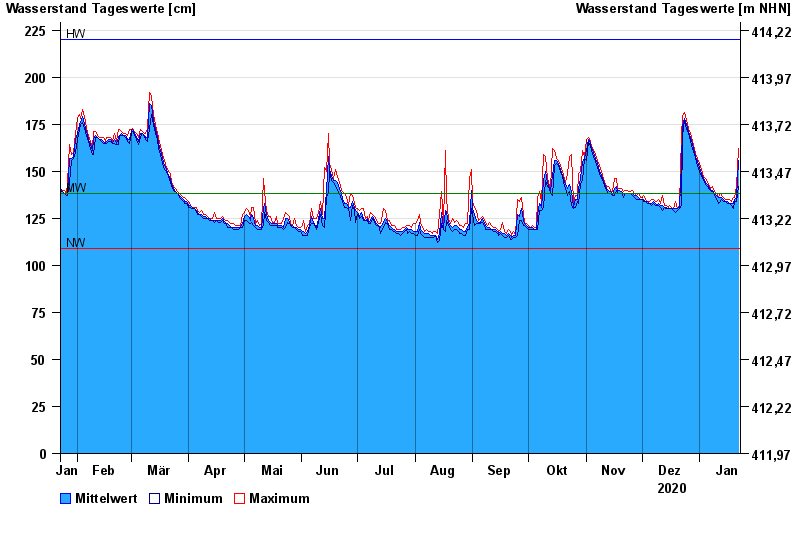
- Chart of year

Chart of year Friedersdorf / Buchbach
Waterlevel from 23.01.2020 to 22.01.2021
| Date | Mean value [cm] | Maximum [cm] | Minimum [cm] |
|---|---|---|---|
| 22.01.2021 | 156 | 162 | 142 |
| 21.01.2021 | 136 | 142 | 134 |
| 20.01.2021 | 135 | 136 | 134 |
| 19.01.2021 | 133 | 136 | 130 |
| 18.01.2021 | 133 | 134 | 132 |
| 17.01.2021 | 133 | 135 | 133 |
| 16.01.2021 | 134 | 135 | 133 |
© Bayerisches Landesamt für Umwelt 2024