
- Start >
- Rivers >
- Waterlevel >
- Oberer Main - Elbe >
- Goldbergsee Ablauf >
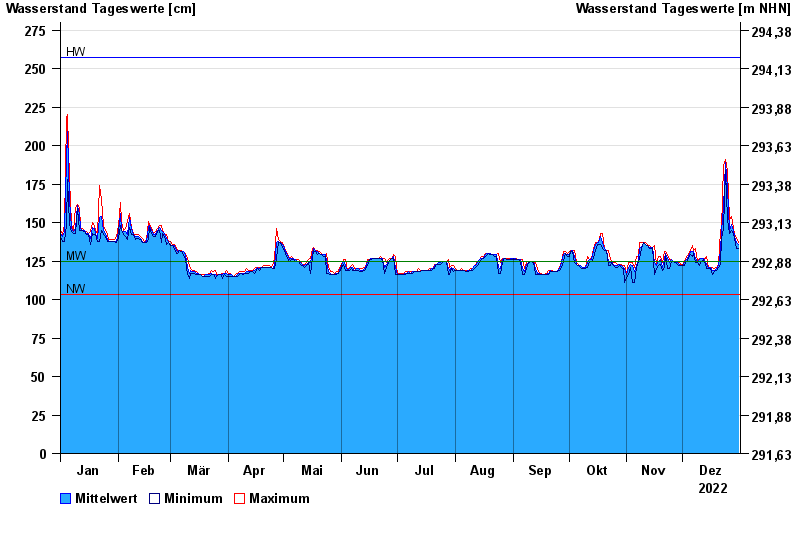
- Chart of year

Chart of year Goldbergsee Ablauf / Sulzbach
Waterlevel from 01.01.2022 to 31.12.2022
| Date | Mean value [cm] | Maximum [cm] | Minimum [cm] |
|---|---|---|---|
| 31.12.2022 | 136 | 137 | 133 |
| 30.12.2022 | 137 | 140 | 133 |
| 29.12.2022 | 141 | 143 | 140 |
| 28.12.2022 | 145 | 146 | 143 |
| 27.12.2022 | 149 | 154 | 145 |
| 26.12.2022 | 145 | 152 | 143 |
| 25.12.2022 | 172 | 184 | 152 |
© Bayerisches Landesamt für Umwelt 2025