
- Start >
- Rivers >
- Waterlevel >
- Oberer Main - Elbe >
- Goldbergsee Ablauf >
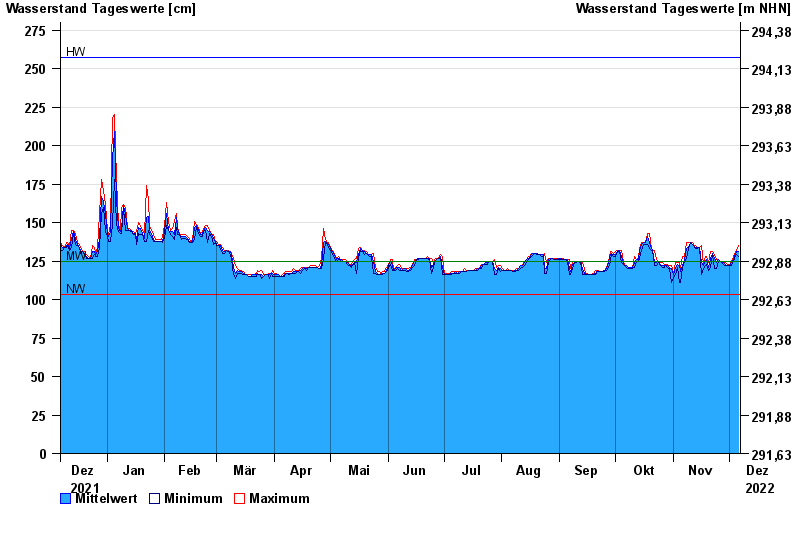
- Chart of year

Chart of year Goldbergsee Ablauf / Sulzbach
Waterlevel from 07.12.2021 to 06.12.2022
| Date | Mean value [cm] | Maximum [cm] | Minimum [cm] |
|---|---|---|---|
| 06.12.2022 | 131 | 135 | 128 |
| 05.12.2022 | 131 | 132 | 129 |
| 04.12.2022 | 128 | 129 | 127 |
| 03.12.2022 | 126 | 128 | 125 |
| 02.12.2022 | 124 | 125 | 122 |
| 01.12.2022 | 122 | 123 | 122 |
| 30.11.2022 | 122 | 123 | 122 |
© Bayerisches Landesamt für Umwelt 2024