
- Start >
- Rivers >
- Waterlevel >
- Oberer Main - Elbe >
- Hohenberg >
- Chart of year

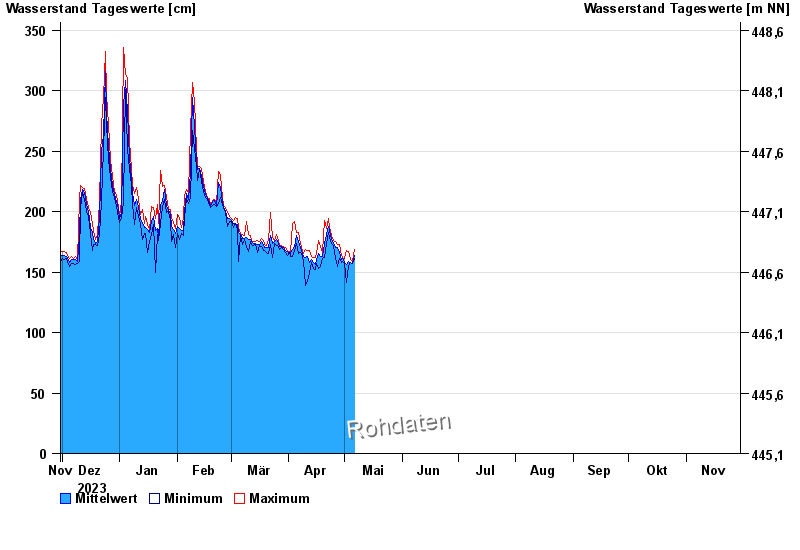
Chart of year Hohenberg / Eger
Waterlevel from 30.11.2023 to 29.11.2024
 Für diesen Pegel sind keine Hochwassermarken hinterlegt.
| Date | Mean value [cm] | Maximum [cm] | Minimum [cm] |
|---|---|---|---|
| 13.07.2024 | 168 | 198 | 146 |
| 12.07.2024 | 154 | 167 | 146 |
| 11.07.2024 | 153 | 158 | 143 |
| 10.07.2024 | 154 | 160 | 151 |
| 09.07.2024 | 155 | 160 | 152 |
| 08.07.2024 | 162 | 168 | 157 |
| 07.07.2024 | 170 | 174 | 164 |
© Bayerisches Landesamt für Umwelt 2024