
- Start >
- Rivers >
- Waterlevel >
- Oberer Main - Elbe >
- Kauerndorf >
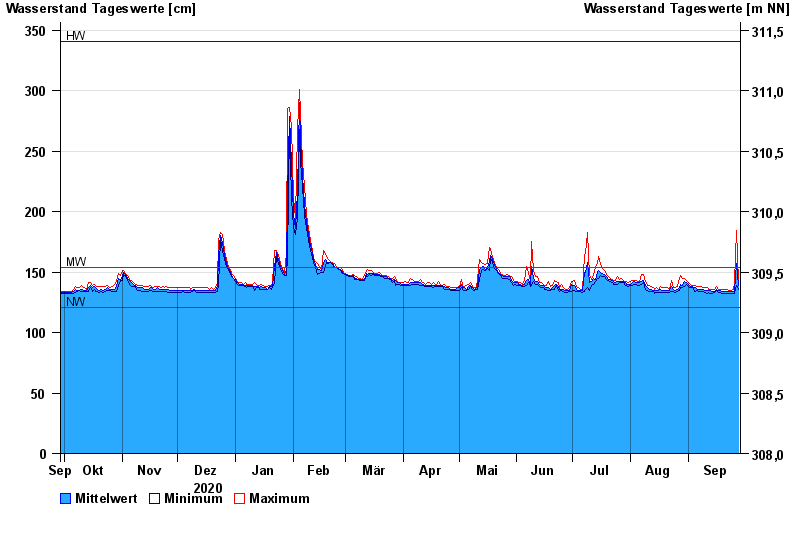
- Chart of year

Chart of year Kauerndorf / Schorgast
Waterlevel from 29.09.2020 to 28.09.2021
| Date | Mean value [cm] | Maximum [cm] | Minimum [cm] |
|---|---|---|---|
| 28.09.2021 | 139 | 142 | 136 |
| 27.09.2021 | 157 | 184 | 139 |
| 26.09.2021 | 134 | 141 | 132 |
| 25.09.2021 | 134 | 136 | 132 |
| 24.09.2021 | 134 | 135 | 132 |
| 23.09.2021 | 134 | 135 | 132 |
| 22.09.2021 | 134 | 136 | 132 |
© Bayerisches Landesamt für Umwelt 2024