
- Start >
- Rivers >
- Waterlevel >
- Oberer Main - Elbe >
- Kautendorf >
- Chart of year

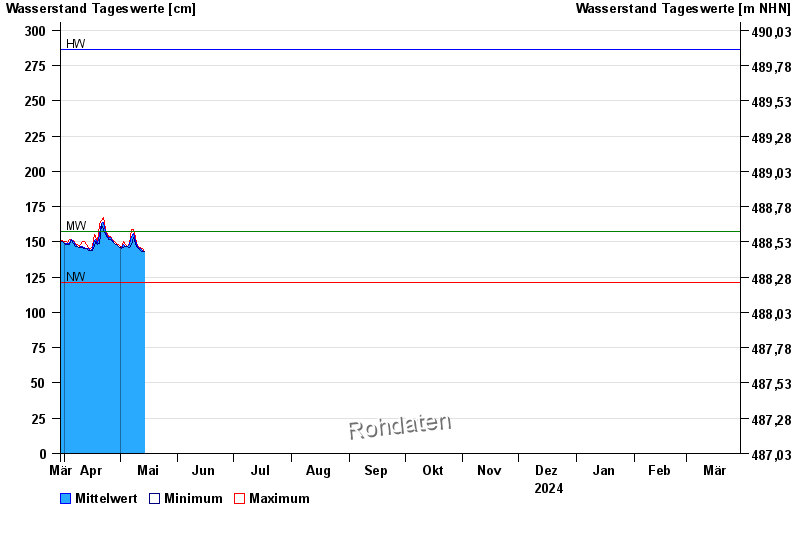
Chart of year Kautendorf / Südliche Regnitz
Waterlevel from 30.03.2024 to 29.03.2025
| Date | Mean value [cm] | Maximum [cm] | Minimum [cm] |
|---|---|---|---|
| 19.10.2024 | 157 | 160 | 155 |
| 18.10.2024 | 157 | 160 | 156 |
| 17.10.2024 | 158 | 159 | 157 |
| 16.10.2024 | 160 | 162 | 159 |
| 15.10.2024 | 163 | 164 | 162 |
| 14.10.2024 | 165 | 168 | 163 |
| 13.10.2024 | 170 | 173 | 168 |
© Bayerisches Landesamt für Umwelt 2024