
- Start >
- Rivers >
- Waterlevel >
- Oberer Main - Elbe >
- Michelfeld >
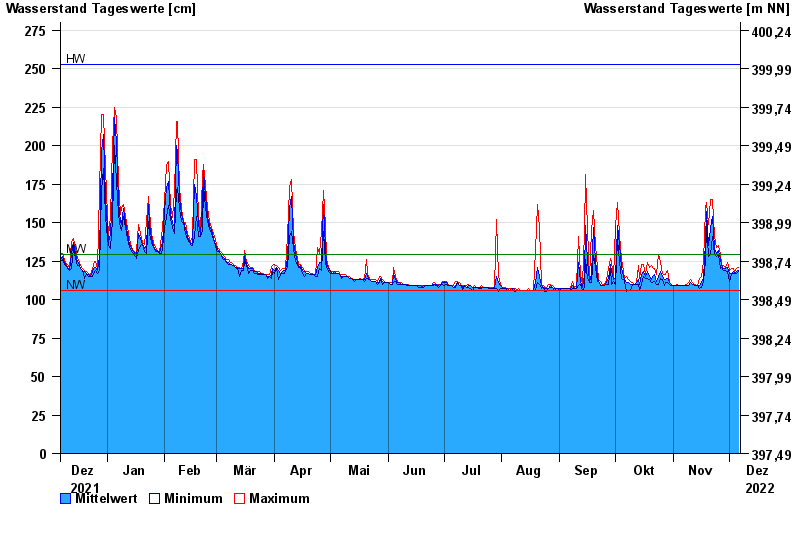
- Chart of year

Chart of year Michelfeld / Pegnitz
Waterlevel from 07.12.2021 to 06.12.2022
| Date | Mean value [cm] | Maximum [cm] | Minimum [cm] |
|---|---|---|---|
| 06.12.2022 | 119 | 121 | 118 |
| 05.12.2022 | 118 | 120 | 117 |
| 04.12.2022 | 117 | 118 | 117 |
| 03.12.2022 | 118 | 120 | 117 |
| 02.12.2022 | 117 | 120 | 116 |
| 01.12.2022 | 117 | 119 | 112 |
| 30.11.2022 | 121 | 124 | 118 |
© Bayerisches Landesamt für Umwelt 2024