
- Start >
- Rivers >
- Waterlevel >
- Oberer Main - Elbe >
- Michelfeld >
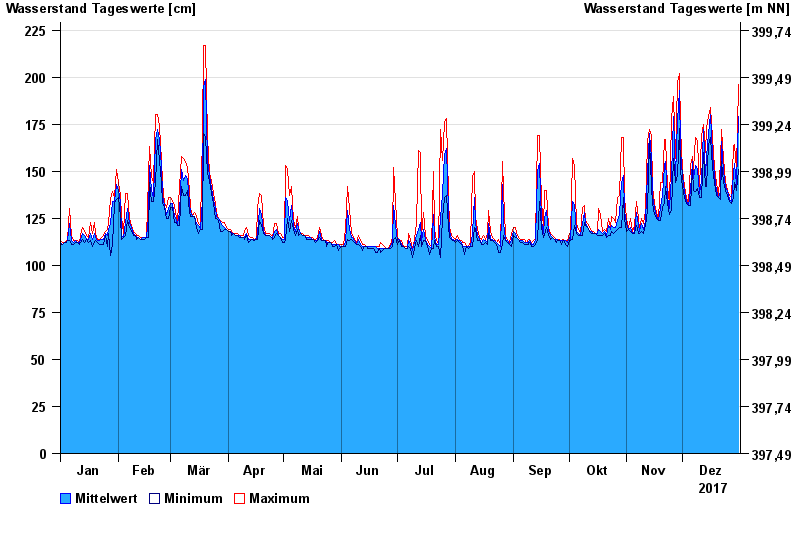
- Chart of year

Chart of year Michelfeld / Pegnitz
Waterlevel from 01.01.2017 to 31.12.2017
- 23.02.1970 Wasserstand: 300 cm
- 18.12.1974 Wasserstand: 255 cm
- 09.01.2011 Wasserstand: 253 cm
- 03.01.2003 Wasserstand: 252 cm
- 25.03.1970 Wasserstand: 252 cm
| Date | Mean value [cm] | Maximum [cm] | Minimum [cm] |
|---|---|---|---|
| 31.12.2017 | 179 | 196 | 151 |
| 30.12.2017 | 143 | 151 | 140 |
| 29.12.2017 | 154 | 164 | 144 |
| 28.12.2017 | 149 | 163 | 136 |
| 27.12.2017 | 134 | 136 | 133 |
| 26.12.2017 | 135 | 137 | 134 |
| 25.12.2017 | 139 | 140 | 137 |
© Bayerisches Landesamt für Umwelt 2025