
- Start >
- Rivers >
- Waterlevel >
- Oberer Main - Elbe >
- Michelfeld >
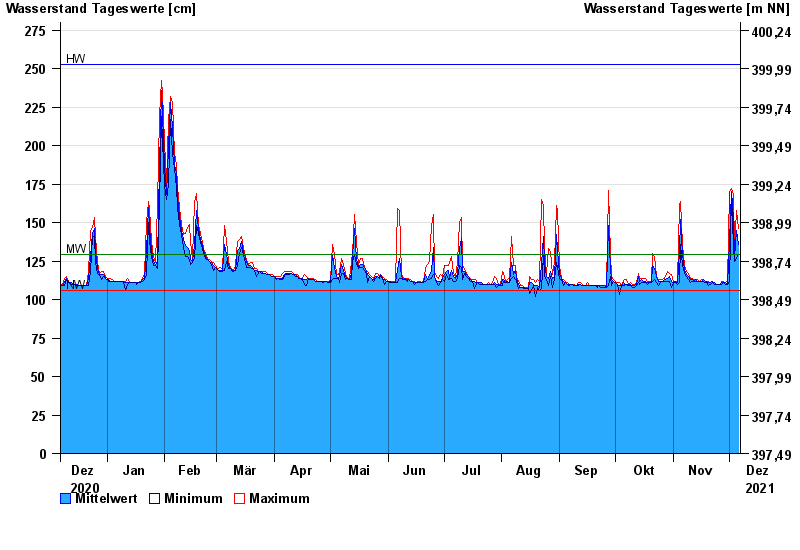
- Chart of year

Chart of year Michelfeld / Pegnitz
Waterlevel from 07.12.2020 to 06.12.2021
| Date | Mean value [cm] | Maximum [cm] | Minimum [cm] |
|---|---|---|---|
| 06.12.2021 | 136 | 146 | 129 |
| 05.12.2021 | 145 | 158 | 127 |
| 04.12.2021 | 127 | 134 | 125 |
| 03.12.2021 | 152 | 168 | 134 |
| 02.12.2021 | 170 | 172 | 168 |
| 01.12.2021 | 138 | 170 | 112 |
| 30.11.2021 | 110 | 112 | 110 |
© Bayerisches Landesamt für Umwelt 2024