
- Start >
- Rivers >
- Waterlevel >
- Oberer Main - Elbe >
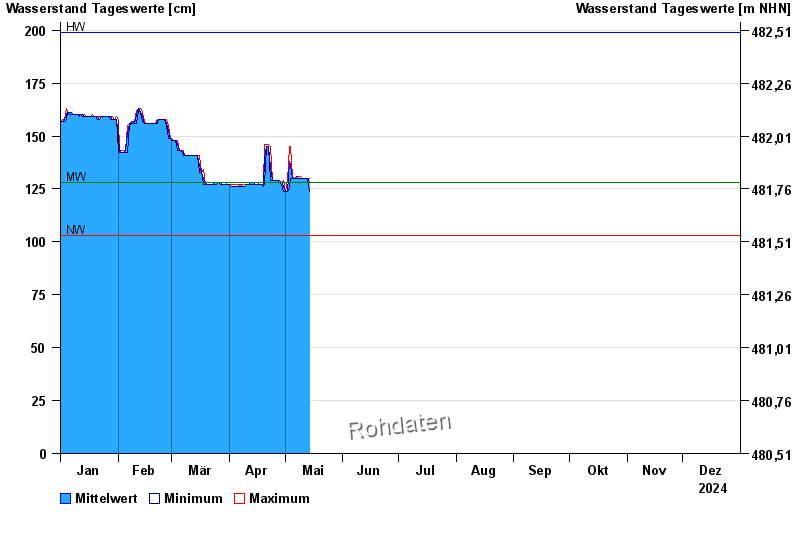
- Moschendorf >
- Chart of year

Chart of year Moschendorf / Ölsnitz
Waterlevel from 01.01.2024 to 31.12.2024
| Date | Mean value [cm] | Maximum [cm] | Minimum [cm] |
|---|---|---|---|
| 31.12.2024 | 132 | 133 | 132 |
| 30.12.2024 | 132 | 132 | 132 |
| 29.12.2024 | 132 | 133 | 132 |
| 28.12.2024 | 135 | 139 | 132 |
| 27.12.2024 | 139 | 139 | 139 |
| 26.12.2024 | 139 | 139 | 139 |
| 25.12.2024 | 140 | 140 | 139 |
© Bayerisches Landesamt für Umwelt 2025