
- Start >
- Rivers >
- Waterlevel >
- Oberer Main - Elbe >
- Oberhammer >
- Chart of year

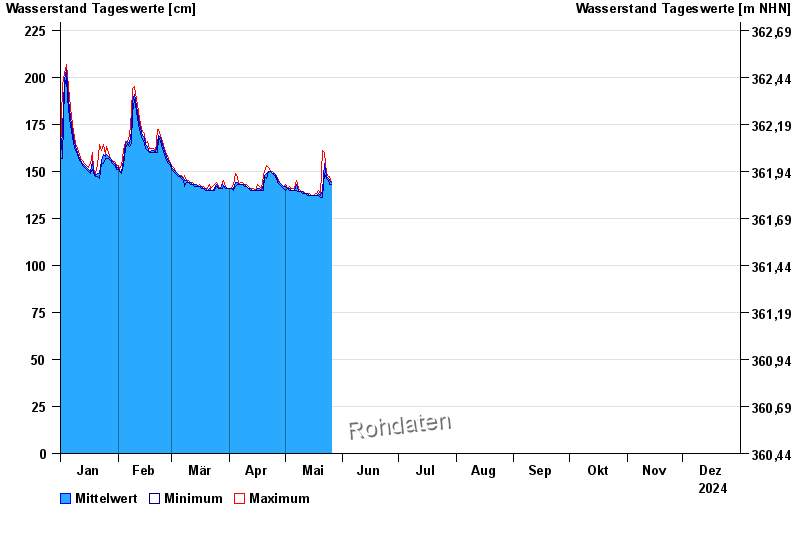
Chart of year Oberhammer / Untere Steinach
Waterlevel from 01.01.2024 to 31.12.2024
| Date | Mean value [cm] | Maximum [cm] | Minimum [cm] |
|---|---|---|---|
| 27.11.2024 | 145 | 146 | 145 |
| 26.11.2024 | 145 | 146 | 143 |
| 25.11.2024 | 144 | 145 | 143 |
| 24.11.2024 | 144 | 145 | 144 |
| 23.11.2024 | 146 | 147 | 144 |
| 22.11.2024 | 148 | 149 | 147 |
| 21.11.2024 | 149 | 151 | 147 |
© Bayerisches Landesamt für Umwelt 2024