
- Start >
- Rivers >
- Waterlevel >
- Oberer Main - Elbe >
- Röbersdorf >
- Chart of year

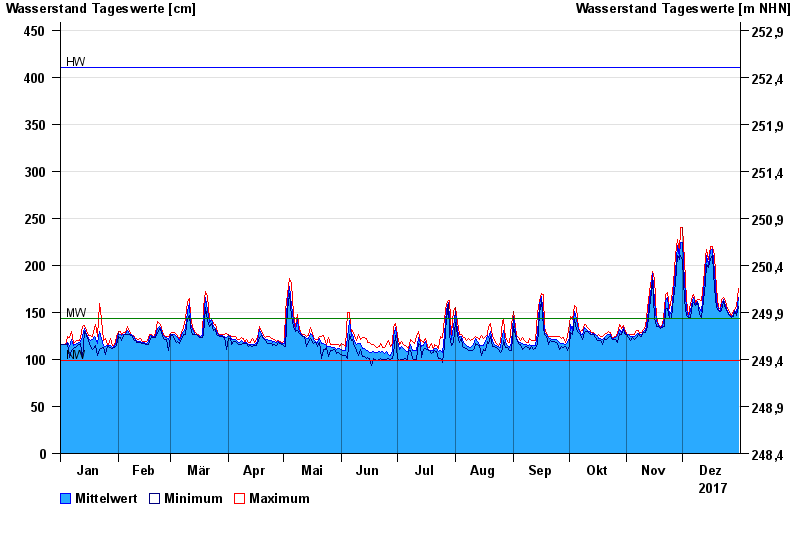
Chart of year Röbersdorf / Reiche Ebrach
Waterlevel from 01.01.2017 to 31.12.2017
| Date | Mean value [cm] | Maximum [cm] | Minimum [cm] |
|---|---|---|---|
| 31.12.2017 | 166 | 175 | 156 |
| 30.12.2017 | 150 | 156 | 147 |
| 29.12.2017 | 152 | 153 | 151 |
| 28.12.2017 | 148 | 152 | 146 |
| 27.12.2017 | 146 | 147 | 145 |
| 26.12.2017 | 148 | 150 | 147 |
| 25.12.2017 | 151 | 154 | 150 |
© Bayerisches Landesamt für Umwelt 2024