
- Start >
- Rivers >
- Waterlevel >
- Oberer Main - Elbe >
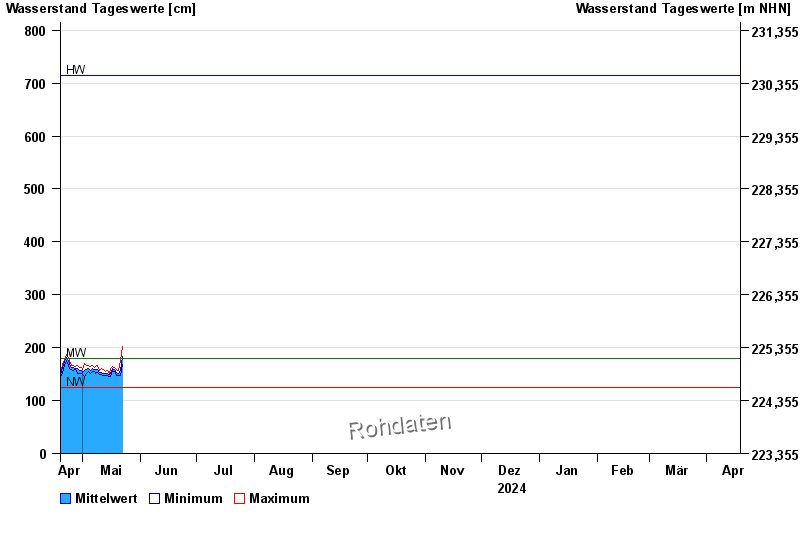
- Trunstadt >
- Chart of year

Chart of year Trunstadt / Main
Waterlevel from 19.04.2024 to 18.04.2025
| Date | Mean value [cm] | Maximum [cm] | Minimum [cm] |
|---|---|---|---|
| 13.09.2024 | 158 | 162 | 156 |
| 12.09.2024 | 159 | 166 | 156 |
| 11.09.2024 | 157 | 161 | 150 |
| 10.09.2024 | 161 | 164 | 157 |
| 09.09.2024 | 158 | 164 | 153 |
| 08.09.2024 | 153 | 157 | 148 |
| 07.09.2024 | 155 | 159 | 151 |
© Bayerisches Landesamt für Umwelt 2024