
- Start >
- Rivers >
- Waterlevel >
- Oberer Main - Elbe >
- Unterbruck >
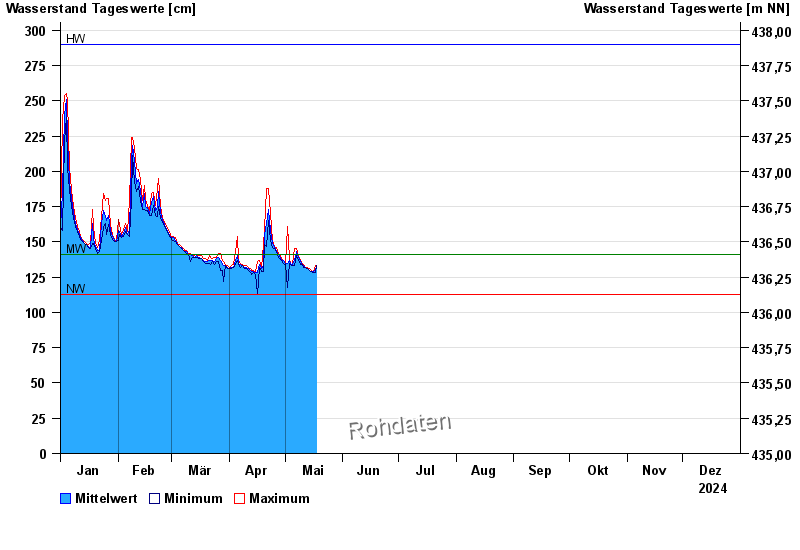
- Chart of year

Chart of year Unterbruck / Haidenaab
Waterlevel from 01.01.2024 to 31.12.2024
| Date | Mean value [cm] | Maximum [cm] | Minimum [cm] |
|---|---|---|---|
| 24.12.2024 | 165 | 165 | 165 |
| 23.12.2024 | 167 | 175 | 163 |
| 22.12.2024 | 166 | 175 | 156 |
| 21.12.2024 | 157 | 161 | 155 |
| 20.12.2024 | 165 | 170 | 160 |
| 19.12.2024 | 152 | 160 | 149 |
| 18.12.2024 | 152 | 154 | 150 |
© Bayerisches Landesamt für Umwelt 2024