
- Start >
- Rivers >
- Waterlevel >
- Oberer Main - Elbe >
- Unterbruck Flutmulde >
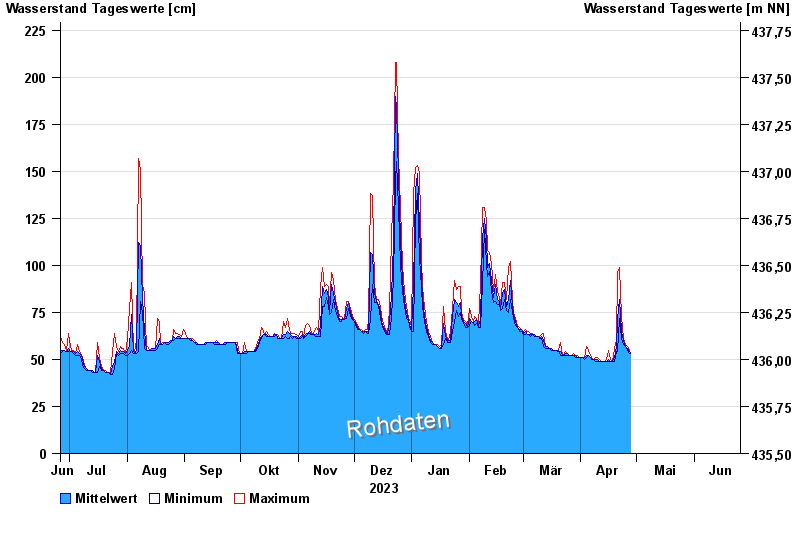
- Chart of year

Chart of year Unterbruck Flutmulde / Haidenaab
Waterlevel from 26.06.2023 to 25.06.2024
| Date | Mean value [cm] | Maximum [cm] | Minimum [cm] |
|---|---|---|---|
| 25.06.2024 | 48 | 49 | 47 |
| 24.06.2024 | 49 | 49 | 48 |
| 23.06.2024 | 50 | 50 | 49 |
| 22.06.2024 | 52 | 59 | 50 |
| 21.06.2024 | 51 | 55 | 50 |
| 20.06.2024 | 51 | 51 | 50 |
| 19.06.2024 | 51 | 53 | 50 |
© Bayerisches Landesamt für Umwelt 2024