
- Start >
- Rivers >
- Waterlevel >
- Iller - Lech - Bodensee >
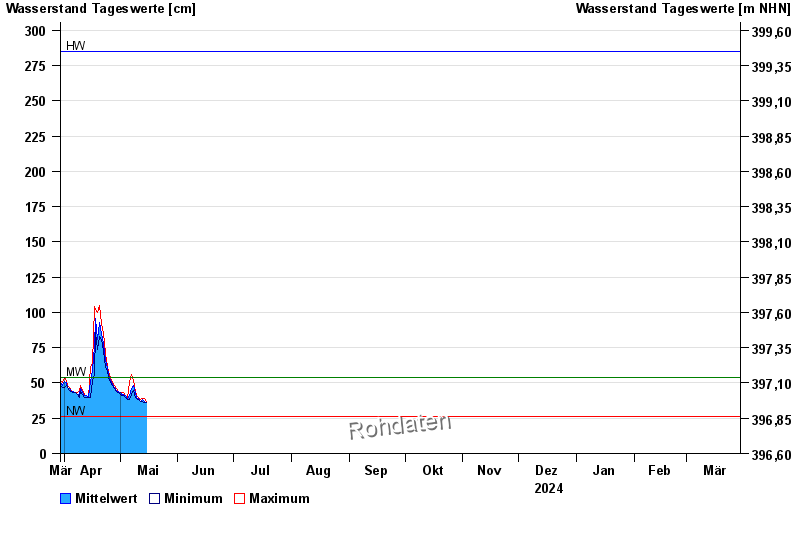
- Aeschach >
- Chart of year

Chart of year Aeschach / Oberreitnauer Ach
Waterlevel from 30.03.2024 to 29.03.2025
| Date | Mean value [cm] | Maximum [cm] | Minimum [cm] |
|---|---|---|---|
| 30.06.2024 | 46 | 50 | 42 |
| 29.06.2024 | 43 | 45 | 42 |
| 28.06.2024 | 47 | 56 | 44 |
| 27.06.2024 | 46 | 47 | 45 |
| 26.06.2024 | 49 | 52 | 47 |
| 25.06.2024 | 52 | 60 | 50 |
| 24.06.2024 | 59 | 64 | 54 |
© Bayerisches Landesamt für Umwelt 2024