
- Start >
- Rivers >
- Waterlevel >
- Iller - Lech - Bodensee >
- Eschach >
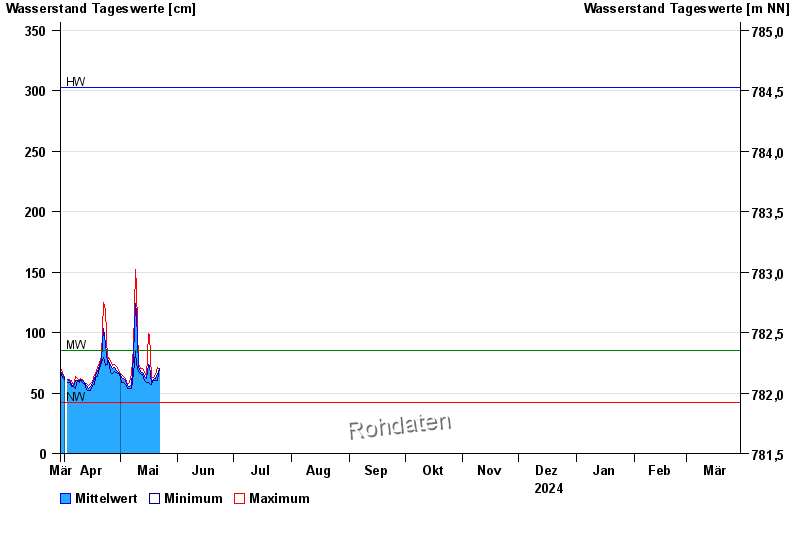
- Chart of year

Chart of year Eschach / Füssener Achen
Waterlevel from 30.03.2024 to 29.03.2025
| Date | Mean value [cm] | Maximum [cm] | Minimum [cm] |
|---|---|---|---|
| 08.08.2024 | 61 | 62 | 60 |
| 07.08.2024 | 60 | 61 | 59 |
| 06.08.2024 | 61 | 61 | 60 |
| 05.08.2024 | 64 | 67 | 61 |
| 04.08.2024 | 77 | 98 | 67 |
| 03.08.2024 | 105 | 114 | 98 |
| 02.08.2024 | 126 | 140 | 114 |
© Bayerisches Landesamt für Umwelt 2024